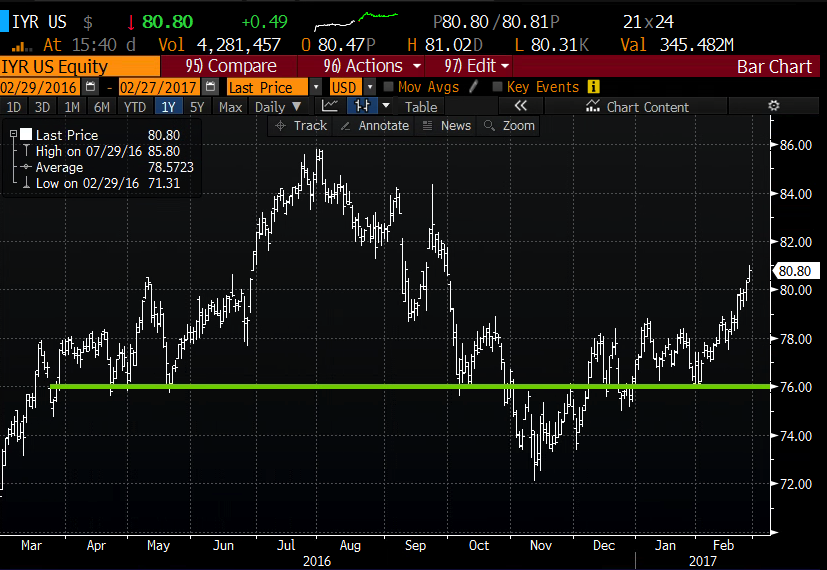
Surprisingly in 2017, sectors deemed to be yield proxies like Utilities and REITS have faired pretty well despite the backdrop of economic reflation ruling the rhetoric in both economic and political circles. The S&P Utilities etf, the XLU is up 6.2% on the year, up 13% from its post election lows in mid November, mirroring the performance of the S&P 500 (SPX) from its pre-election day lows in early November. The iShares Real Estate etf, the IYR is up 4.4% in 2017, and up 12% from its post election lows. Despite the recent strength, both the XLU and the IYR have yet to make new 52 week highs, still down bout 3% and 6% respectively.
All that said, it appears that at least one trader in the options market was playing for a pullback, or possibly placed a hedge on the IYR between now and June expiration. When the etf was trading $80.75 shortly before 2pm today, a trader bought the June 80/75 1×2 put spread 10,000 by 20,000 to open for .45 cents, or $450,000 in premium.
Let’s break this trade down. The trader bought 10,000 of the June 80 puts for $2.60 and sold 20,000 of the June 75 puts at $1.075. So the trader is long 1 of the near the money puts with about a 47 delta, and short 2 of the out of the money puts that have about a 23 delta, so when you double up the short deltas the trade structure at the current price has no delta, despite being a debit spread. As time passes the ratio-ed out of the money short puts should decay faster than the near the money long puts if the etf is below the 80 strike. All things being equal if the etf were to slowly decline this position should gain in value if it were to go in the money, even while starting flat deltas. If the etf were to rally the position would be sure to be a loser, and this would accelerate as we got closer to June expiration.
On June expiration, if the etf were in the money then the position has significant leverage. The break-even is $79.55 on June expiration, with the max gain of $4.55, or 10x the 45 cents at risk. So on 10,000 contracts that is risking $450,000 to possibly make up to $4.55 million if the etf were between $79.55 and $75 on June expiration with the max payout at $75. The payout would trail-off between $75 and $70.45, with the worst case scenario that the IYR was below $70, on top of the 45 cents loss, or $450,000, the trader would lose as if they were long 1 million shares of stock.
I suspect the trader was targeting the mid $70s as $76ish has served as decent support on a few occasions over the last year: