Gilead (GILD) is one of the hardest hit stocks in the healthcare space, down nearly 35% from its all time highs made last April. The chart from the highs is a textbook example of how cheap can get much cheaper, even in a bull market. The stock made an apparent blow-off top last Spring, culminating in a large gap on volume from the highs, a series of lower highs and lower lows and last week it crescendoed with a massive gap lower following earnings:
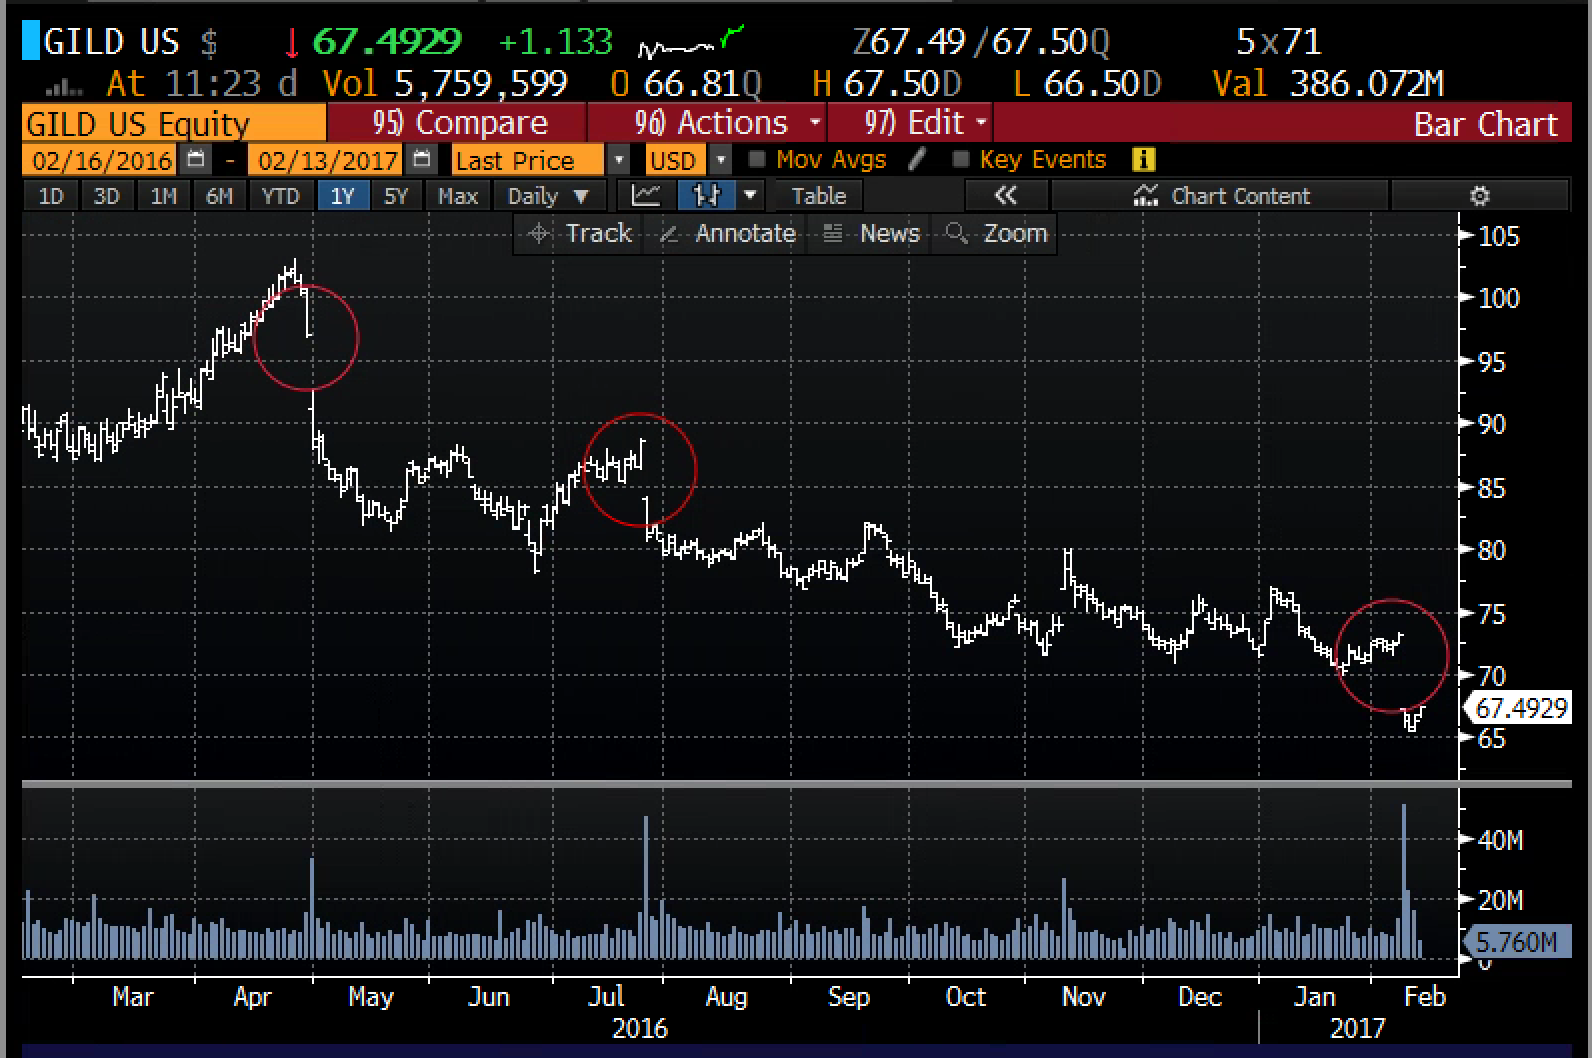
Some of the action in the options pits today suggests that traders are playing for a gap fill higher, with call volume outpacing puts 3 to 1. There was one apparently bullish trade that caught my eye shortly after the open when the stock was trading $67, a trader sold 2500 of the Jan18 60 puts at $4.10 and bought 2500 of the Jan18 70 calls for $5,15 resulting in a $1.05 debit for the position. If this position is opening, (It appears so) the trader would profit on Jan18 expiration if the stock is above $71.05. They would lose $1.05 between $60 and $70. Their worst case scenario is if the stock drops below $60. In that case they would lose $1.05 on 2500 contracts (or $262,500 in premium) but also put 250,000 shares of stock at $60 and suffer losses below. Obviously the trader can always close the position prior to expiration and not risk being put the stock, but on a mark to market basis, the position will show gains if the stock were to rally towards the long call strike and suffer losses as the stock declines towards the short put strike,
One last thing, to my eye, the next stop on the downside is in fact the $60 level:
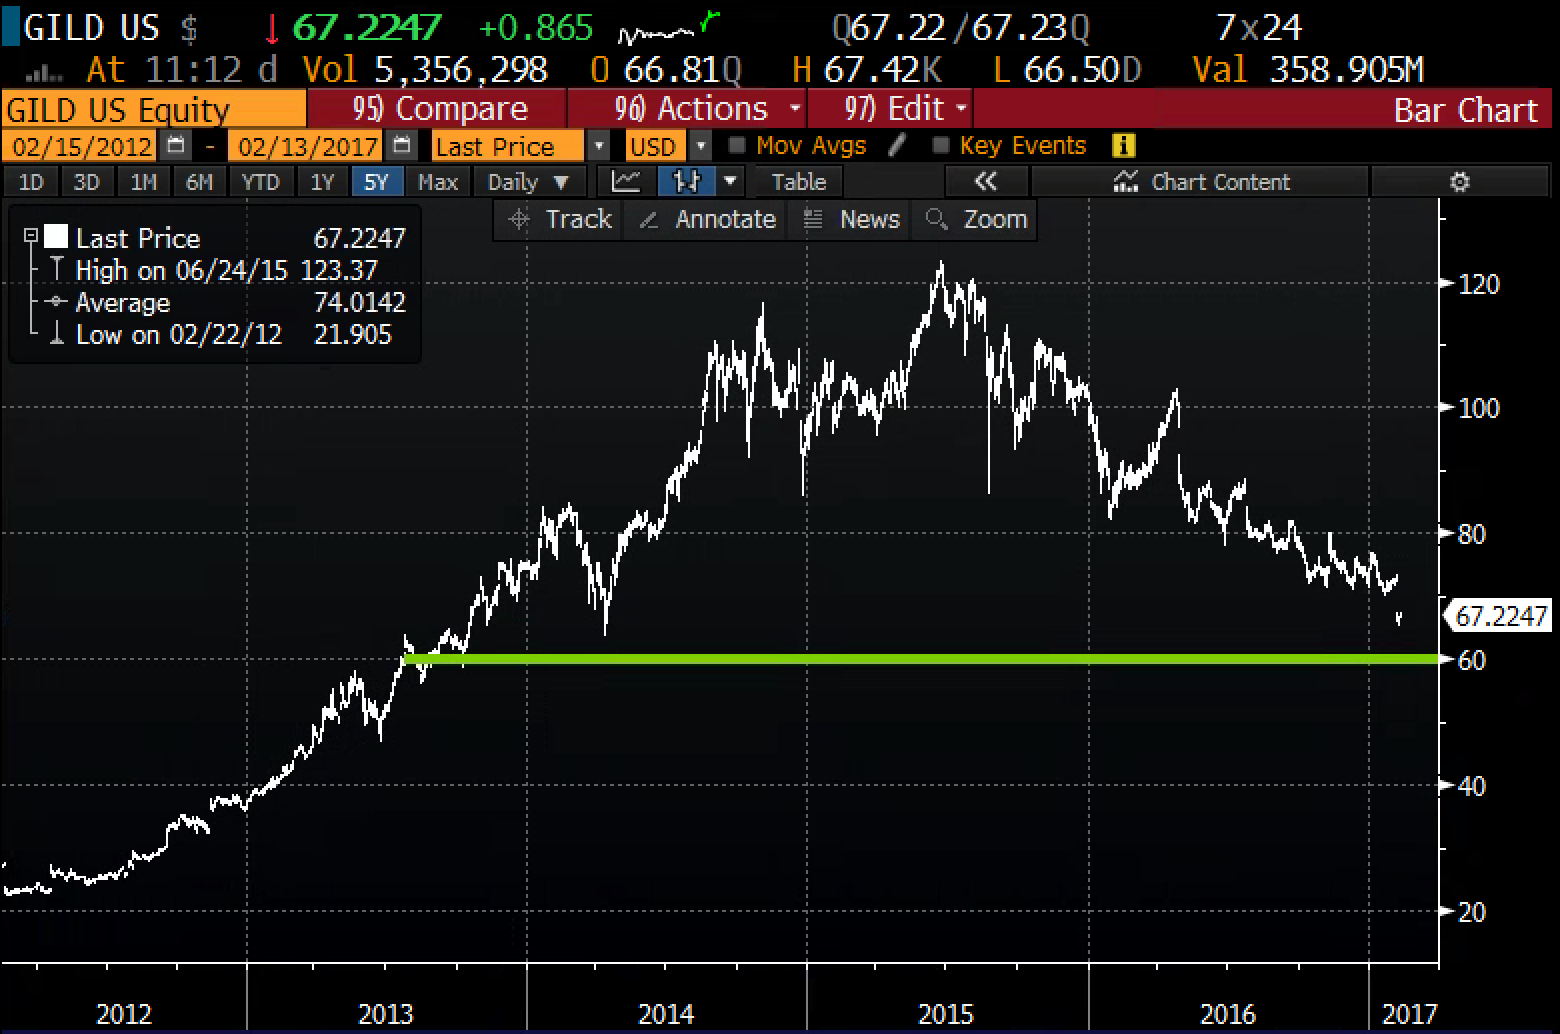
This trader is willing to buy stock at that level, their short put on the 60 strike acts like a buy order below. And in case the stock suddenly reverses higher and fills in the gap to the upside, the long call will act like a buy order above.