Should We Be Nervous About the Auto Sector?
The economic recovery is now 7 years old. By historical standards, this one is getting a bit long in the tooth. The National Bureau of Economic Research (NBER) estimates that from 1945 to 2009, the typical business cycle lasts about 6 years, 5 up years following by a single down year. This has us thinking about the investment merits of companies operating in cyclical industries.
The new administration’s infrastructure development program along with a push to bring manufacturing back to the US has made investing in industrial and manufacturing companies a “theme” among investors. The chart below shows a comparison of the relative performance of cyclical stocks versus defensive stocks (food, consumer products, etc.) since the election. It shows that cyclical stocks have substantially outperformed the defensive stocks. (see the area circled in blue below). The FTSE USA Cyclical Index, for example, is up 15% in the 3 months ending January 2017, while defensives are up only 2.7%.
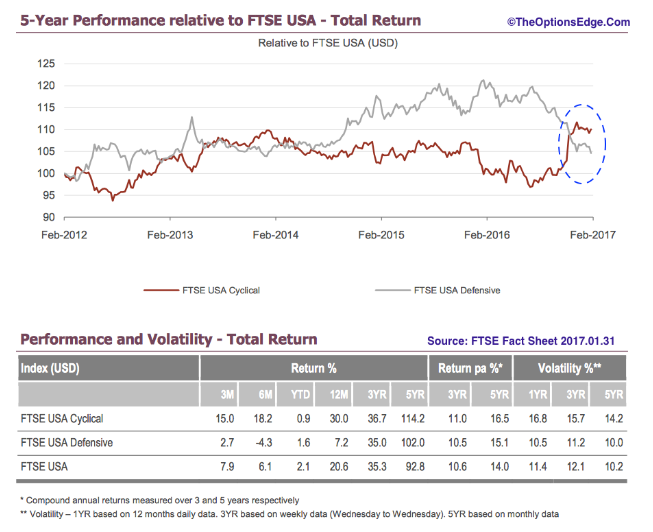
After such a big move, we are wondering if cyclical stocks have fully discounted the change in government policy. A change in government policy suggests to us that this is at least a cyclical change. Whether or not this is a secular change will depend on the quality of the legislation and on the implementation of the new policy. One area that still looks cheap to us in the manufacturing area is automobile manufacturing. One of the reasons why the stocks of the major car companies trade at low PE multiples relative to the median stock in the S&P500 is the amount of auto loan debt outstanding. The bears argue that with high levels of auto debt, car sales are sure to slow down because consumers will have to hold on to their cars longer to pay off the old car loan before thay can buy a new car.
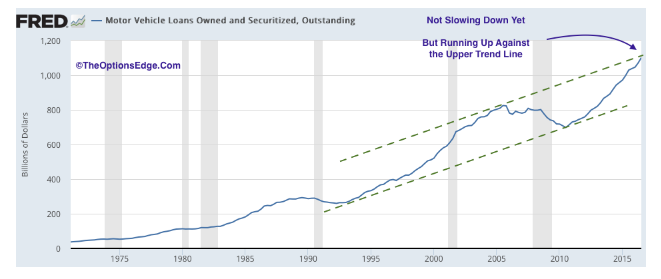
Indeed the chart of motor vehicle loans outstanding shows that it is bumping up against the long-term growth trend. At the same time, the rate of growth of auto loans outstanding is not slowing down. If fact it looks like it will break above the upper trend line before this cycle is over. This suggests to us that the bears might be too early.
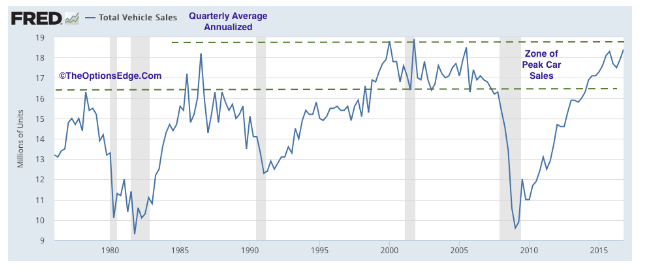
The chart above shows the annualized vehicle sales in the US. It is now comfortable trading at the top of its historical range, at 18.4 million units. The question is, “how long will it stay at these cyclically peak levels?” It could quickly reverse, like it did in the mid1980s, or it could stay at these levels for a number of years like it did in the 1990s. The scenario followed will depend on the health of the economy and the affordability of cars themselves.
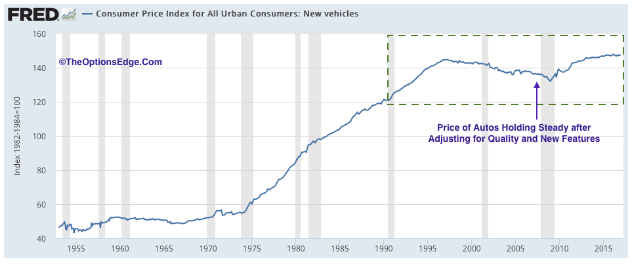
The chart above shows the inflation index for new vehicles. It shows that the price of cars has held steady for the last 10 years or so, after adjusting for improved quality, performance and features. This tells us that cars are just as affordable now as they were 10 years ago.
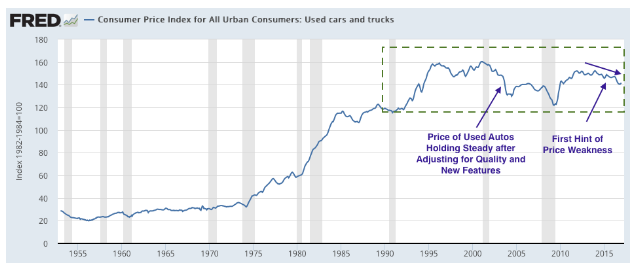
Not every thing is hunky dory on the pricing picture. The following chart shows the inflation index of used cars, and is shows that the price of used cars is under some pressure. This is good news for used car buyers, but it does have the potential to put some pricing pressure on new cars.
We think the balance of evidence suggests the auto industry is in pretty good shape, and if the economy holds up, the auto manufacturers should do well. Valuation is reflecting heavy negative sentiment. The following table summarizes a few valuation multiples for General Motors, Ford, Toyota Motor Corp, and Fiat Chrysler. (We did not include Tesla as it is not profitable and it trades with cult status.) All these companies trade at very depressed valuations. To the contrarian in us, these companies look quite attractive. We think single digit PEs discount a “worst case” scenario of double-digit fall in sales and profits over the next year or two.
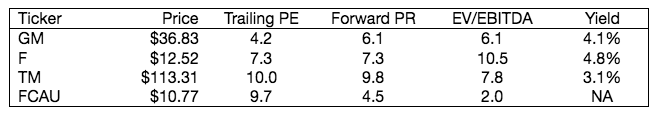
If you agree with our thesis that these traditional auto manufactures are undervalued and are priced for a near worst-case scenario, you could buy the share of anyone of these brands or take an industry position and allocate a little money to all four. We think the shares of all these companies are cheap, but if we had to pick one, based on valuation, it would be GM.
By the way, GM reported its financial performance on Tuesday, February 7th. They beat on the top line with $43.9 billion in revenue versus estimates of $41.5 billion, and they beat on EPS, 1.28 vs. $1.17. Guidance for earnings next year is in the $6.00 range, which is about flat year-on-year. This guidance clearly disappointed investors as the stock price tumbled about $2 on the news. It seems value stocks cannot get a break. At $35.14 a share, the company is trading at a forward-looking PE of just 5.9.
While none of the price charts of the car companies are outright bullish, GM offers the best trading set-up. What makes us nervous about the bullish case is the swift drop after the earnings announcement. Technically speaking, we may have just witnessed a false breakout of a sideways trading pattern that stretches back to 2013. If this is the case, the stock is likely pullback more before heading higher.
One way to trade GM on a short-term basis is to buy the stock against the short-term rising trend line. The idea is to buy the stock here with a stop loss at $34.00 a share. If the price falls below that price, sell as the next level of support is around $27.50. If the short-term bullish trend is intact, $34 should hold and the share price should move higher.
If you want to do this trade, but think the upside is more limited and want capture a little more income, you might want to sell a call against the stock. If the $41 level holds, and the investor select the June 16, 2017 (regular) expiration $39.00 strike call, you can collect 2 dividend payments of $0.38 a share on top of the option premium of $0.56. The $39 strike will leave a little room for potential capital gains.
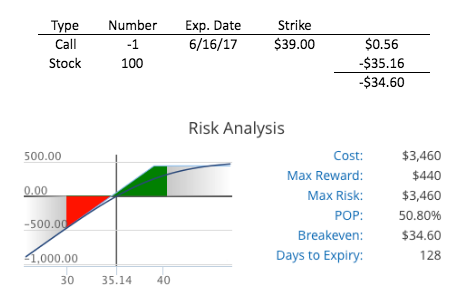
To initiate this trade, the investor will pay a $34.60 up front per buy-write. The June 2017 expiration was selected to give the trade time to develop and to capture a few dividend payments, for an annualized yield of 10.9% [{(2x 0.38 + 0.56)/34.60} x 365/128]. If the stock rallies above the $39 strike by expiration, the investor will capture an addition $3.84 in capital gains for an annualized return of 42.5%. The breakeven level is $34.60, which is almost 1.6% below the current price (excluding dividends). The efficient market hypothesis suggests there is just over a 50% chance of success on this trade if held to expiration.