Monday morning I discussed a New York Post article suggesting Amazon.com was considering going far bigger into bricks and mortar grocery stores than what the company had previewed in December with their AmazonGo concept for clerk-less convenient stores (Do Amazon Dream of Electric Shoppers?). My immediate thought was that this could lead to some sort m&a among higher end grocery markets:
While investors might immediately think this could be the end of Whole Foods Markets (WFM) and smaller rivals like Sprouts Farmers Markets (SFM), it might make sense for AMZN to purchase the infrastructure and re-automate the stores in locations that consumers are already conditioned to go to.
For instance, SFM operates 220 stores in about a dozen states that include two of the most populous in the U.S. (California and Texas) ranging from 28,000 to 30,000 square feet, with 20,000 employees. The company has about $4 billion in annual sales, that grew 12% in 2016, down from 21% yoy growth in 2015. It’s not just Amazon coming for your grocery store, but big box retailers like Costco, Target and Walmart, and that’s really who Amazon is pitted against, not to mention Kroger that operates nearly 4,000 stores in 35 states nationwide, with $155 billion in trailing 12 month sales. So Amazon’s move has little to do with the likes of WFM or SFM as they have bigger fish to fry, but both will be swept up in the disruption, and one of the two could even be a means to an end for Amazon in their broader grocery battle.
Last night, fairly uncharacteristically, Amazon CEO Jeff Bezos went to Twitter to refute the details of the Post’s story:
.@nypost, whoever your anonymous sources are on this story https://t.co/VFyzGQcOAZ – they’ve mixed up their meds!
— Jeff Bezos (@JeffBezos) February 7, 2017
And on the NYPost article, if anybody knows how to get 20% margins in groceries, call me! 🙂
— Jeff Bezos (@JeffBezos) February 7, 2017
As for AMZN’s grocery plans, I suspect we will see something in between their Go format that the company teased, and what the New York Post projected.
Which brings me to WFM, which is scheduled to fiscal Q1 results tonight after the close. The options market is implying about a 6% one day earnings move tomorrow, which is rich to the average one move following the last 4 quarters, but shy of the 10 year average one day post earnings move of about 9%.
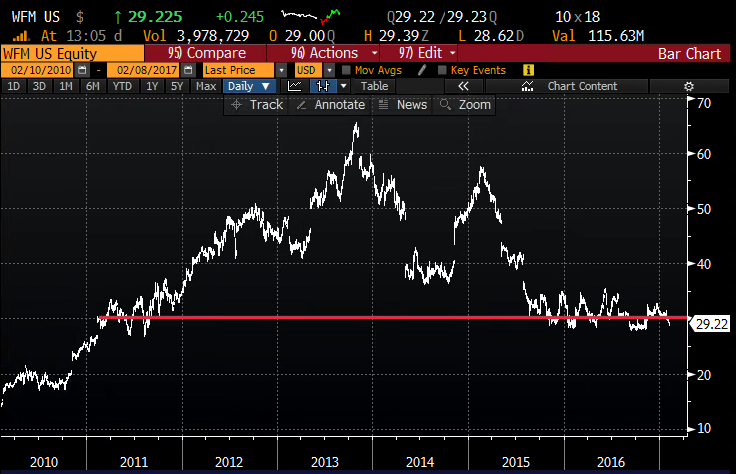
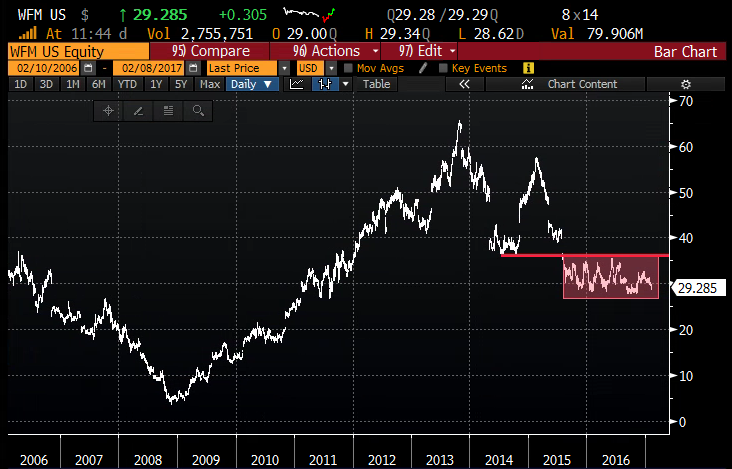
As I stated in Monday’s post, the price action and the chart is an absolute trainwreck, already down 5% on the year, down 17% from its 52 week highs made in June 2016 and down 55% from its all time highs made in late 2013. The 10 year chart shows just how precarious the 18 month consolidation below $35, since its July 2015 gap:
Aside from the poor price action, sentiment is downright horrible, Wall Street analysts hate the stock with only ^ buys, 15 Holds and 6 Sells, with an average 12 month price target of $29.80, 2% above where the stock is trading, with short interest close to 10%.
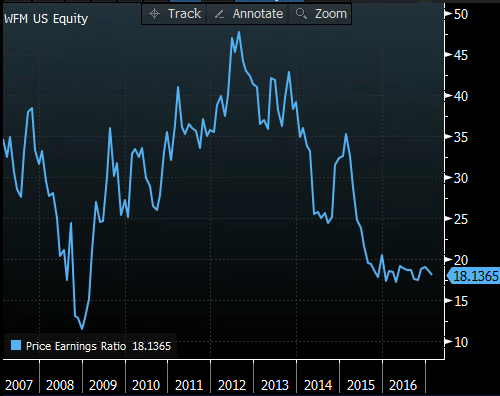
Fiscal 2017 eps is expected to decline 8% year over year on a 3% sales increase, and trades 20x expected 2017 eps of $1.44 a share (18x e2018), and .57x sales. Not exactly cheap, given the massive deceleration in eps growth and tepid sales growth, but well below valuation levels when the company was growing 20% plus a year on its ways to the 2013 highs:
So What’s the Trade?
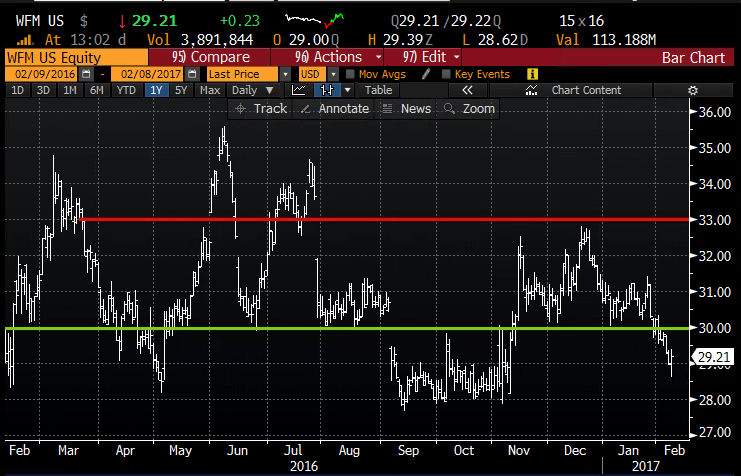
It’s entirely possible that the stock is putting in a base and is ready for a short squeeze if results and guidance are not as bad as expected. That would likely see the stock back to the December high near $33. But that’s a big if, and it makes sense to define risk rather than be long the stock if you are already long the stock or looking to play for a quick move higher:
Stock Alternative/Replacement
WFM ($29.17) Buy March 30 / 33 call spread for 67 cents
-Buy 1 March 30 call for 82 cents
-Sell 1 March 33 call at 15 cents
Break-Even on March Expiration:
Profits: up to 2.37 between 30.67 and 33 with max gain above
Losses: up to 67 cents, between 30 and 30.67, with max loss of 67 cents below 30
Rationale: $30 appears to be near term resistance, a break above on news could have the stock re-testing the Dec highs. If the stock fails here and breaks below support this trade is only risking .67 versus what could be a a couple of digits lower in the stock.
For those long the stock or looking for that breakdown, below massive long term support at $28, you might consider a longer dated put spread targeting a move back to the mid to low $20s:
Bearish/Hedge
WFM ($29.17) Buy May 28 / 24 put spread for $1
-Buy to open 1 May 28 put for 1.32
-Sell to open 1 May 24 put at 32 cents
Break-Even on May Expiration:
Profits: up to 3 between 27 and 24 with max gain of 3 below 24
Losses: up to 1 between 27 and 28, with max loss of 1 above 28
Rationale: Without a meaningful guide up, or some sort of m&a discussed above this stock is likely to continue to grind lower, but in the event of a meaningful guide down, the stock could gap to new 52 week lows to the mid $20s. This trade works as both a hedge vs long stock or an outright bearish trade and has a few months to play out so doesn’t simply isolate earnings: