Is There Enough Economic Growth to Push Stock Prices Higher?
For stock to continue to rise, we think the economy needs to accelerate to drive earnings growth and/or interest rates need to fall. Since we believe that the 30+year bull market in bonds is probably over, we need to focus our attention on the economy at large. To be clear however, just because interest rates have bottomed, this does not meant they are about to embark on a strong and relentless rise. We think long-term interest rates will move ever so slowly higher over the upcoming year, with 50 basis point swings along the way. The only caveat to this expectation is GDP growth. If we get growth in nominal GDP in excess of 4 or 5%, it is possible for the yield to maturity on 10 year US treasuries to trade north of 3% (currently 2.43%).
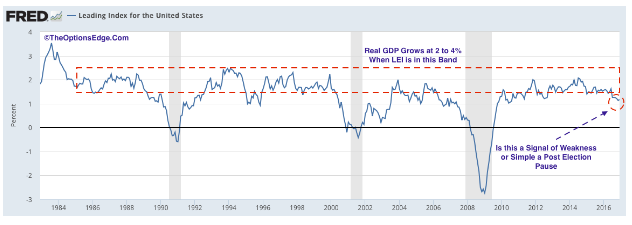
The chart above shows the rate of change of one of the government’s measures of leading economic activity. It provides a clue about economic growth rates 3 to 6 months into the future. This predictor of economic growth has slowed a bit since the election, suggesting a sub 2% growth rate in the months ahead.
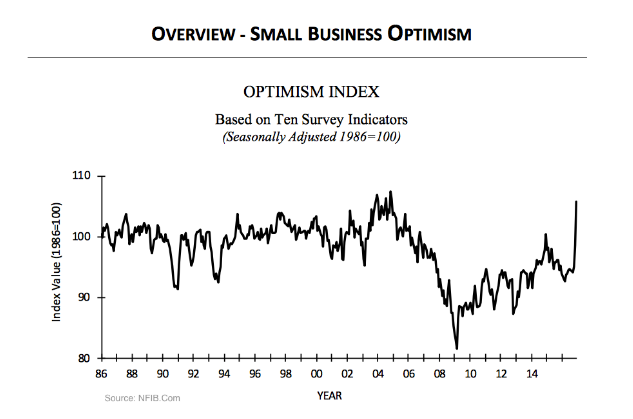
When people are optimistic, they buy stocks, start or expand businesses, go shopping more, make large purchases, go out to dinner, etc. Therefore, measures of optimism and pessimism can have some predictive power concerning future economic activity. The NFIB Research Foundation has been doing surveys of small businesses since 1973 to gauge their feeling about their economic prospects. They issue a reading of their Optimism Index every month. It seems that small business owners have become more enthusiastic over the past few months. Indeed, the index hit 105.8, which is the highest reading since December 2004. This indicator is telling us that we might be looking at real GDP growth north of 3% by the second or third quarter of 2017.
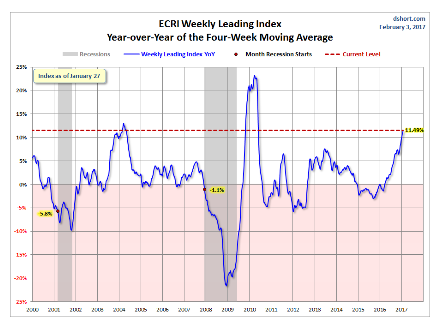
The Economic Cycles Research Institute, publishes a weekly Leading Economic Index. This index is flashing the all-clear sign as well. The chart below shows the rate of change of the ECRI Leading Economic Index on a year-over-year basis. This index is telling us that we should expect acceleration in GDP growth over the year ahead, probably north of 3.5%.
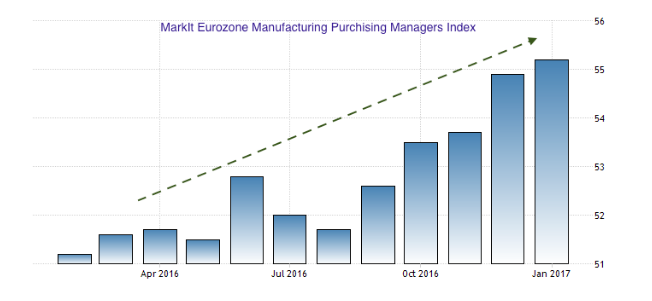
Even the European economy is looking better. The MarkIt Euro Area Manufacturing PMI is signaling expansion. As the chart below shows, this index has been improving for about 6 moths now, and is well over the 50% level. This tells us European businesses are seeing an expansion in their business activity.
Putting all these leading indexes together suggests economic growth over the next year or two will probably be faster than the last few years. Baring some unforeseen event, this faster economic growth should help companies grow their profits.
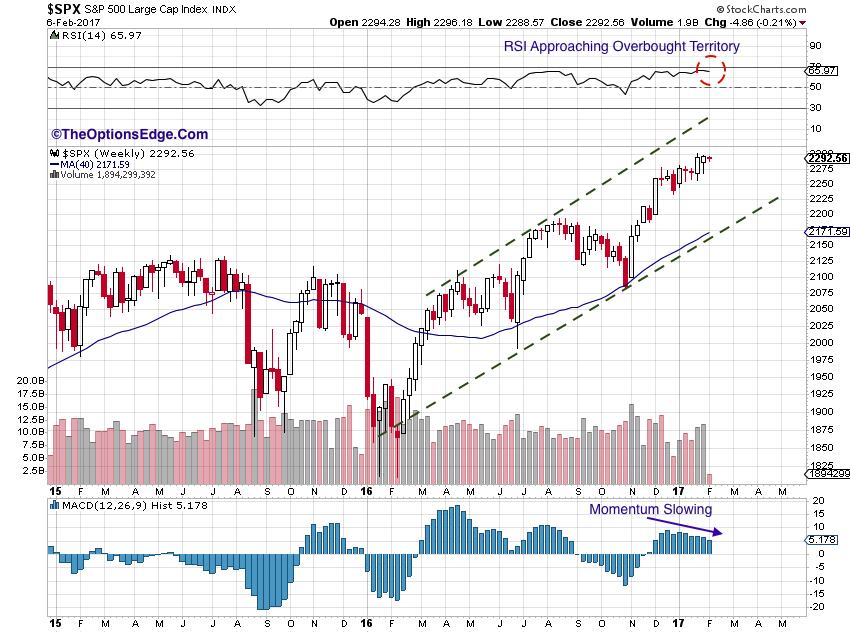
Over the long-term the economy tends to drive the equity markets. Over the short-term however, the equity markets can have a mind of their own. So how should we think about our portfolio from a tactical point of view? The chart of the S&P500 above shows the index has been rising in a bullish trend channel for about a year. While it has not reached the top of that channel yet, the RSI is approaching overbought levels and upward momentum is slowing down. As a result, we think there is a good possibility that the price of SPX will trade down toward the lower trend line before the next strong move higher. If you agree with this thesis, you might want to wait for a dip before adding to your portfolio and/or trimming some winners that have reached your trading objective.