Event: Facebook (FB) will report Q4 results tonight after the close. The options market is implying about a 5% one day move tomorrow which is shy of the 4 quarter average post earnings one day move of 5.8%.
The technical set up into the print is fairly treacherous when you consider the stock’s 14% year to date gains, with the stock just below the prior all time high made in late October, prior to their Q3 results:
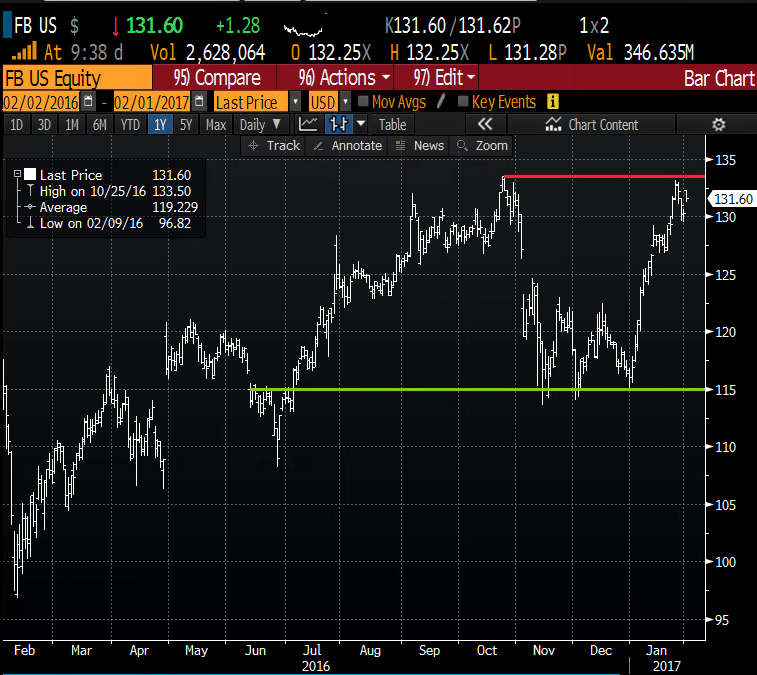
After a two months of under-performance relative to the broad market in November and December, shares of FB exploded, adding $53 billion in market capitalization, nearly double their expected sales in 2017. The investment community remains overwhelmingly bullish in the stock with 47 Buy ratings, only 4 Holds and 2 Sells, with an average 12 month price target of $153, or about 17% above the current levels, while short interest is less than 1% of the float.
Certainly, Facebook has been an extraordinary story since going public in 2012, after its initial 50% decline in the months after its IPO, the stock has risen nearly 650%, now sporting a market cap of $380 billion, making it the fifth largest company in the S&P 500!
When people ask me why Snapchat wants to go public, looking at Facebook’s history offers some of the obvious benefits. Managing rapid growth in the public eye can be a real hassle, but the fact that the company was going public likely gave them the confidence to purchase Instagram for $1 billion the month before ipo, and then the ability to use their currency to pay $22 billion for the mobile messaging app WhatsApp less than 2 years after the ipo, coupled with their $2 billion purchase of Oculus Rift the same year. These three acquisitions are driving much of the company’s current growth and help investors see a path for continued hyper growth with the potential of monetization of these properties/platforms.
But regular readers know we gravitate towards looking for holes in universally loved stock market stories.
Following FB’s Q3 results on Nov 2nd, the stock declined 5% after the company guided to greater than expected operating expenses. This is an issue as the company has suggested they are reaching limits on. Especially on the amount of ads they can place on their core product. That’s leading to decelerating revenue growth at a time where the potential to add new users in the free world is running out. That has Zuckerberg and Co courting countries like China, while considering ways to comply with their censorship.
$FB “can solve this by either making more humans (hard even for Facebook) or connecting what humans there are left on the planet” @antoniogm https://t.co/xN4XpmdHEN
— Dan Nathan (@RiskReversal) January 31, 2017
Facebook is pulling out all the stops to reenter China. Nothing is working. https://t.co/2dwgiGbaHp
— Wall Street Journal (@WSJ) January 30, 2017
I suspect that this willingness to consider complying in censored news in China, and their slowness to address Fake News in the U.S. will cause investor concern eventually if legitimate advertisers balk at being associated. And investors could have an itchy trigger finger on the slightest bit of disappointing results and guidance as a result.
Make no mistake, the company’s expected revenue growth rate of 34% in 2017 is astounding from last year’s $27 billion, but it’s important to note that for those citing the company’s forward P/E of 25, on an expected $5.25 in eps is really 31.5x on a GAAP basis, which is still ok given the expected growth, but you have to keep it real.
So what to do with the stock into the print? I suspect it will take a meaningful beat and raise for the stock to breakout to new highs above the implied move. That said I thought the same about Apple (AAPL) yesterday prior to its report and investors seemed to be fairly giddy with just a beat and a mild downgrade to revenue guidance. But the two charts are different.
Bullish:
Mike Khouw and Carter Worth detailed a bullish trade into the print on Fridays Options Action, defining risk into the event by buying the March 135/145 call spread for $2.85 (vs stock $131.50):
FANG stocks are breaking out – here’s how @Michael_Khouw is trading $FB into earnings $AMZN$NFLX$GOOGLpic.twitter.com/QLRwEoyurY
— Options Action (@OptionsAction) January 30, 2017
This trade makes sense for those expecting a sharp breakout higher, and for those who are comfortable risking what they are willing to lose. In this case, with an out of the money call spread, with a break-even up at $137.85, up nearly 5% from current levels. This is not exactly out cup of tea, as we will offer our usual disclaimer for long premium directional traders into events, you need to get a lot of things right to just break-even, first and foremost, direction, timing and magnitude of the move. Selling a downside put at a level where you would be comfortable buying the stock could be a reasonable way to finance the purchase of a call or call spread. But you would only do that if you did not think the stock would meaningfully outperform the implied move on the downside in the event of a disappointment.
Bearish/Hedge:
As for looking down with the stock at all time highs, there’s probably buyers lurking below $125 on a decline, so isolating that level is probably the best bet. There are two ways to do that, one targeting that area this month inexpensively, the other targeting that area near term to finance protection/bearish view out a few months:
Short Term Bearish – Buy the FB (130.80) Feb 130/125/120 put fly for .90
- – Buy 1 Feb 130 put for 3.60
- – Sell 2 Feb 125 puts at 1.70 (3.40 total)
- – Buy 1 Feb 120 put for .70
Rationale – This risks just .90 with the potential to make up to 4.10 if the stock is 125 on February expiration. If the stock is significantly higher after earnings the trade will be close to worthless, but if the stock goes nowhere and stays near 130 it should hold most of its value with more than 2 weeks until expiration. In the case of a move lower all the profits won’t be realized instantly so patience will be in order, but if the stock declines by a few dollars it would certainly be a double, with more profits to come over the next two weeks if the stock stays near 125. There’s some risk of the stock declines alot, any move below 120.90 and you are below the lower break-even (the fly is actually long deltas below 125), so this is for people looking to target the 125 area in line with the implied move, not for those looking for a home-run decline of 5%+ (the implied move).
Or
The second way to position bearishly is to finance longer dated puts with the sale of the weekly 125 put:
Financing Longer Term Bearish View – Buy the FB (130.80) Feb3rd/April 125 put calendar for 2.50
- – Sell 1 Feb 3rd weekly 125 put at 1.15
- – Buy 1 April 125 put for 3.65
Rationale – This trade again targets a move on earnings in line with the implied move. The difference is that it then sets up for further declines for the next few months. If the stock were to decline following earnings, but remain above $125, this trade would be immediately profitable, but then has optionality to extend the view by closing the Feb3rd short put and rolling it farther out to continue a put calendar or a lower strike in April to create a put spread vertical. If the stock is higher on earnings, the trade will lose money, but it won’t be worthless, and the Feb3rd put sale at 82 vol will soften the blow of buying April puts for 32 vol. The Feb puts will basically be worthless if the stock is 130 or higher tomorrow. If the stock goes nowhere, the trade is in great shape. Like the butterfly above, the put calendar does have risk on a large decline, below 125 as it also becomes long deltas below that level. But similar to the put fly it wont actually lose money until closer to 120. So again, this is for those looking for a decline in line with the implied move of 5%, not a home-run short.