Later this week, two of the largest, and sometimes most controversial stocks in the entire stock market, Amazon and Facebook, report Q4 earnings (FB tomorrow, AMZN Thursday). The two companies have a combined market capitalization of $765 billion, and the options marker is implying about a 5% one day post earnings move for each, or about $20 billion in market cap each.
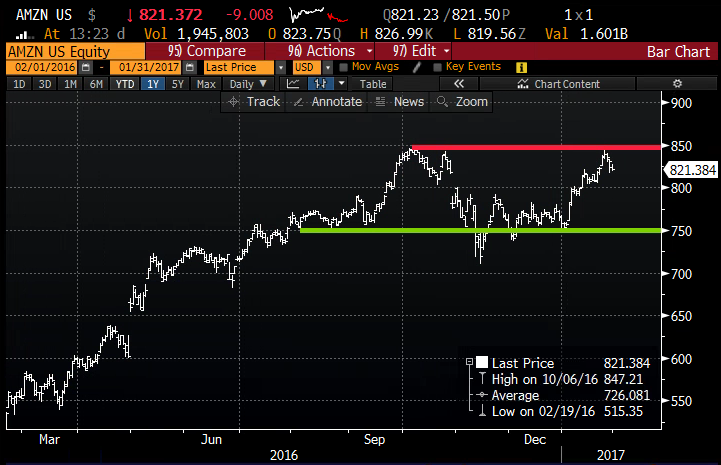
AMZN: The implied move of 5% is a tad below the 4 quarter one day average post earnings move of 5.8%. With the stock at $820, the Feb 3rd 820 straddle (the call premium + the put premium) is offered at $41, if you bought that and thus the implied earnings move you would need a rally above $861, or a decline below $779 to just break-even.
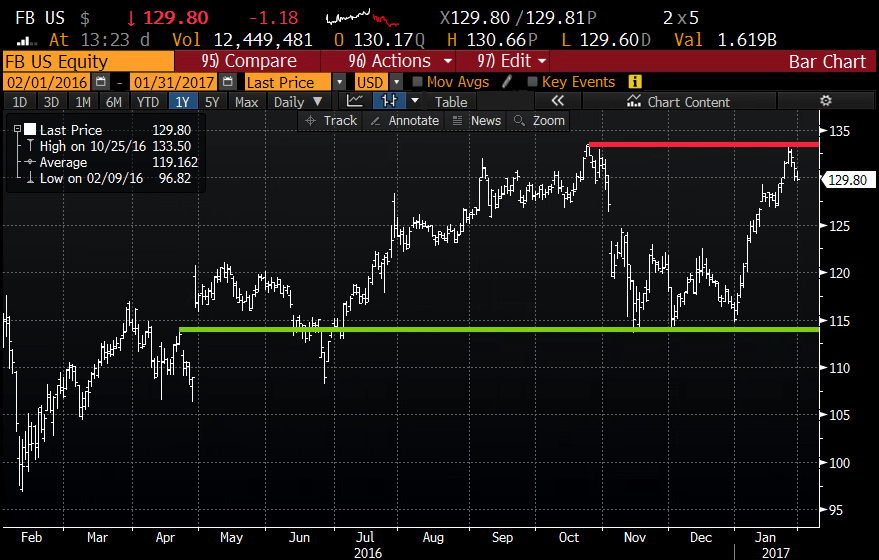
FB: The implied move of 5% is well below the 4 quarter one day average post earnings move of 7.5%. With the stock at $130, the Feb 3rd 130 straddle (the call premium + the put premium) is offered at $6.60, if you bought that and thus the implied move you would need a rally above $136.60, or a decline below $123.40 just to break-even.
There are a couple similarities between these two stocks worth noting. On their Q3 calls in late Oct/ early Nov, both companies guided 2017 spending above consensus estimates causing investors to sell the stocks the next day, resulting in a slightly more than 5% one day decline for each. After nearly two months of relative under-performance while the broad market rallied, both stocks seemed to shrug off their late 2016 doldrums, surging 10% and 13% for AMZN & FB respectively.
And then both stocks stopped last week, just short of their prior all time highs from October, making fairly well defined double tops, while their early Jan bounce levels offer obvious technical support:
AMZN 1 year Chart from Bloomberg:
FB 1 year Chart from Bloomberg:
We’ll be back tomorrow with some trade ideas for both.