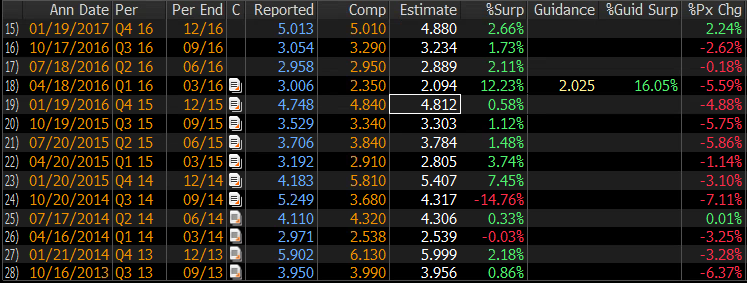
On January 18th IBM reported Q4 results and offered 2017 guidance that beat expectation. The company saw its stock rise the day after, for the first time in 10 quarters:
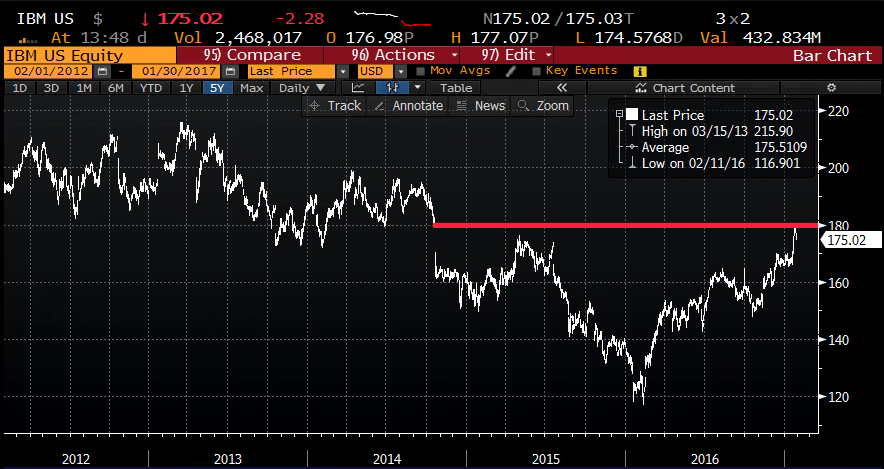
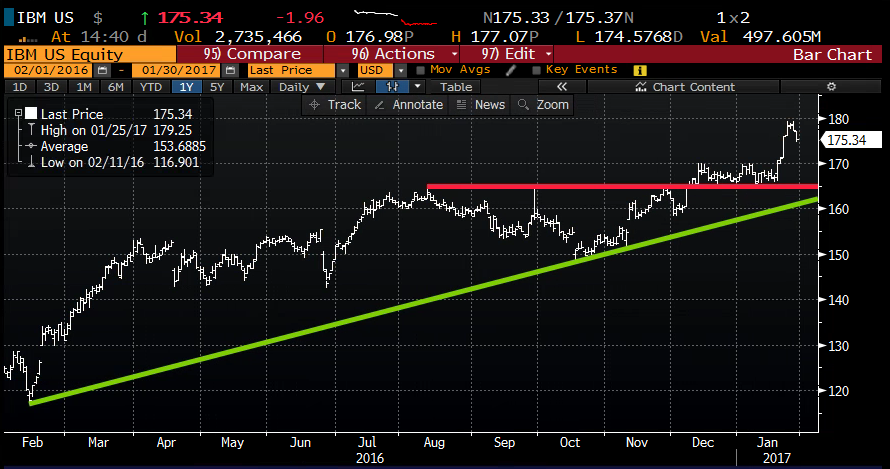
The stock’s post earnings strength hit a wall at longer term technical resistance at $180, the level in which it gapped lower from, and has not been back above since October 2014:
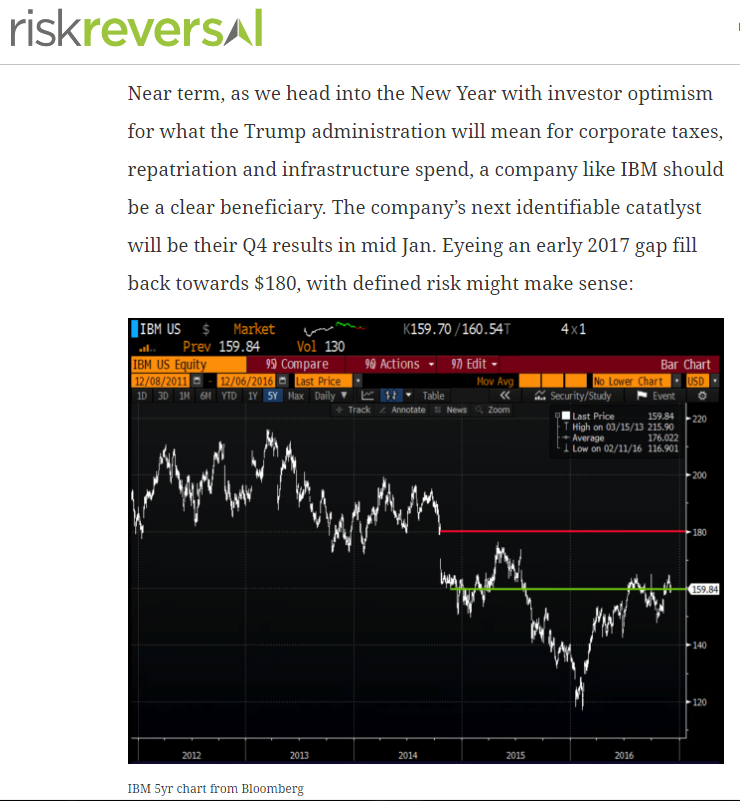
Back on December 6th (here) we identified a few reasons why the stock could move quickly back towards the $180 resistance level:
Consensus eps estimates are calling for a 1% year over year increase, despite sales falling 1%, for the 6th consecutive sales decline, which would mark a drop from nearly $107 billion in annual sales in 2011 to this year’s expected $79 billion. The stock trades 12.7x expected 2017 eps a tad below Apple (AAPL), but well above AAPL ex-cash which makes little sense. At this point I see few ways for the stock to move towards $200 without a massive broad market rally, or as I outlined in August (here) some sort of corporate action “possibly a trans-formative acquisition or the prospects of a split like of their hardware and software/services businesses like we saw from Hewlett Packard in 2015”.
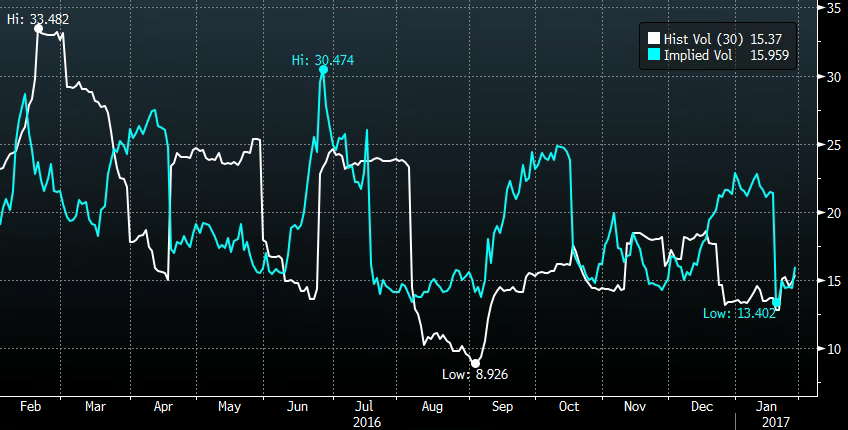
For those considering directional trades in IBM, short dated options prices are very low, with 30 day at the money implied volatility at 16% (blue below) just a shade above 30 day realized volatility (how much the stock is moving, white below) at 15.37%. So long premium directional trades look attractive:
And obvious bearish trade is to target the 165 level for a pullback. That’s the support level just below the recent consolidation prior to the post earnings breakout:
But even with vol low we don’t want to risk a ton of change or decay until earnings on April 18th. One way to keep things cheap is to finance an April put with a near term sale and continue to roll the calendar if the stock remains above 170 over the next 2 months:
Bearish
IBM ($175.50) Buy the Feb /April 170 put calendar for $3.00
- – Sell to open 1 Feb 170 put at 1.15
- – Buy to open 1 April 170 put for 4.15
Rationale – This is a mildly bearish positioning near term, targeting 170, with the chance to finance a cheap put or put spread for earnings right before April expiration. Ideally the stock pulls back a bit towards 170 before February expiration. That short Feb 170 put can then be rolled to the March 170 puts as long as the stock is still above 170. If we get to March expiration with the stock still above 170 we’re left with a very cheap April put. There is risk if the stock gaps lower below 170 in the near term, but it would have to significantly lower for the premium to be at too much risk. Of course a move higher and the premium is at risk, so we’d keep a 50% stop on the 3.00 paid if the stock goes significantly higher.