Event: Texas Instruments (TXN) reports Q4 results tonight after the close. The options market is implying a little less than a 3.5% one day post earnings move, which is a little rich of the 4 qtr average post earnings move of 3% and the 10 year average one day post earnings move of 3.3%. With the stock at $77 the Jan 27th 77 straddle (the call premium + the put premium) is offered at $2.70, if you bought that and thus the implied movement between now and Friday’s close (most being allotted for earnings) then you would need a rally above $79.70 or a decline below $74.30 to make money, or a little less than 3.5% in either direction.
Shares of TXN are up 5% year today making a new all time high, breaking out from a near two month consolidation, with no overhead technical resistance, this is what we call uncharted territory.
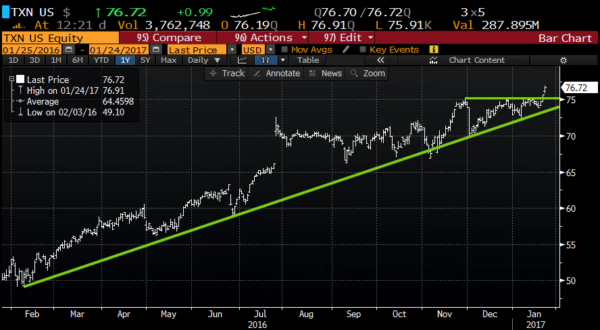
TXN trades 24x trailing eps, and 22x expected 2017, which consensus has growing at 8%, on 4% expected sales growth, this is very near a 10 year high. After a 2 year period that saw TXN’s main competitors scramble to acquire and merge in an effort to diversify away from the saturated smartphone market, and the PC market that has seen declining growth rates, TXN has enjoyed no pressure to join the $200 billion m&a binge that has gone on in the semiconductor space as their exposure in the industrial space has given them a unique position to be patient in a market where valuations have surged. The company has a very clean balance sheet vs their $77 billion market cap, with $3.6 billion in debt and $3.1 billion in cash. TXN books less than 20% of their sales in the U.S.. So any sort of tax reform on foreign profits would be viewed as boon to eps.
If you were inclined to play for a beat and raise and higher highs, it might be wise to consider defined risk strategies as a long stock alternative given the relatively benign options prices:
So what’s the trade?
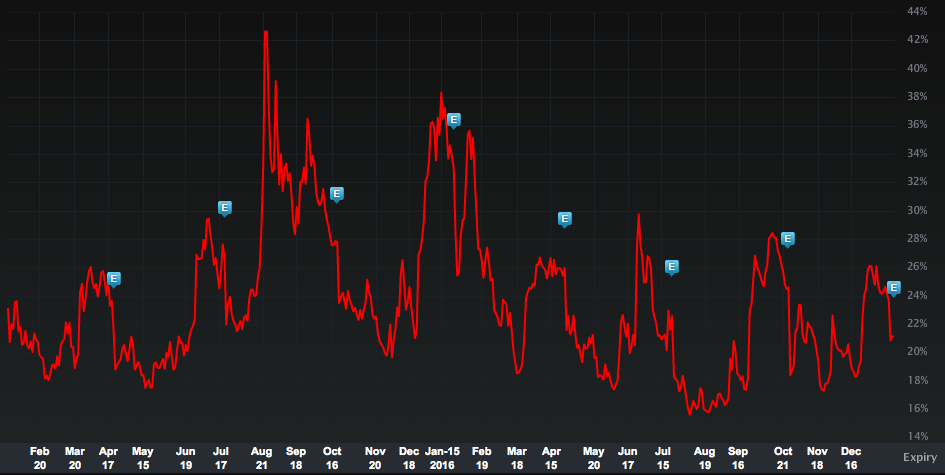
Near term volatility is higher into the event with the Jan27th weeklies about 45 vol. The outer months remain low, near historically low levels in fact. The April at the money implied vol is under 20, with the lows (on chart above) over the past 2 years finding vol buyers when it gets below 18-ish. For instance, with the stock 77, the slightly out of the money Jan27th weekly 72.5 calls are about $1. Going out to Feb regular on the same strike it’s only about .30 more for the same call, with 3 weeks more time for a move higher, and March is about .80 more for nearly two extra months time. For the purposes of a long stock alternative, it makes sense to look farther out and simply buy an at the money call that is less than the implied move into this Friday:
In lieu of 100 shares of TXN ($77) Buy the April 77.5 call for 2.50
Rationale – The implied move into Friday is about 2.75. This call plays for a continued breakout in the stock and gives itself 3 months until expiration. It’s break-even on the upside is about in line with the implied move of the event itself. If the stock tanks on the event, the most that can be lost is less than the implied move. But it’s unlikely that even on a move lower the entire amount is lost as it expires in April. April vol is only about 19.50 so it’s unlikely there will be a massive move lower in implied vol. If the stock moves higher on earnings this call could easily be spread with a higher strike in April like the 85’s.