Event: Netflix (NFLX) will report Q4 results tomorrow after the close. The options market is implying about a 10% one day post earnings move, which is shy to the 11.25% average over the last 4 quarters, well below the 15% average over the last three quarters, and below the stock’s 10 year average post earnings move of 13%.
With the stock at $135, the Jan 135 straddle (the call premium + the put premium) is offered at about $13. If you bought that and the thus the weekly implied move, you would need a rally above $148, or a decline below $122 by Friday’s close to just make money.
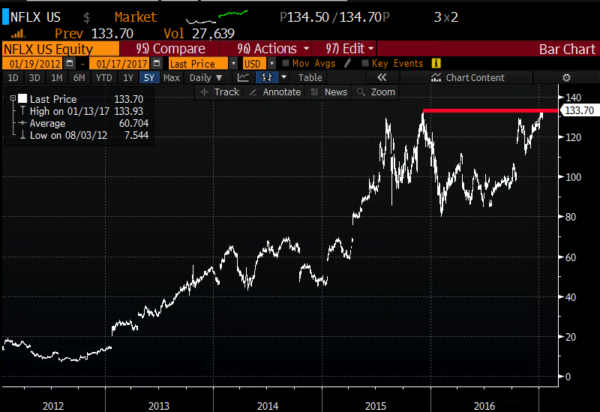
Price Action / Technicals: NFLX is up 10% on the year and up a whopping 34% since its Q3 earnings report in mid October, and up a whopping 67% from its 52 week lows made in mid February 2016:
 NFLX 5yr chart from Bloomberg[/caption]
To suggest that the stock may be at an inflection point may be an understatement. It’s back to the prior all time high. Last time that happened it immediately preceded a 40% peak to trough decline. It has taken 11 months to get back to this level. And into the event, obviously NFLX has a history of post earnings volatility.
But don’t just take my word for it. Friday on CNBC’s Options Action, Carter Braxton Worth, of Cornerstone Macro Research did a little charting of his own and came to the conclusion that this puppy is ready to breakout:
Expectations: in a note to clients last week, RBC’s Internet Analyst Mark Mahaney highlighted the following for investors to keep an eye on:
Netflix will report Q4 results on Wednesday, January 18: We are looking for $2.47B in total revenue and $0.13 in GAAP EPS, right in line with Street estimates and guidance. We are looking for Domestic Streaming Sub Adds of 1.46MM in Q4 (vs. the Street’s 1.44MM) and International Streaming Sub Adds of 3.75MM (vs. the Street’s 3.74MM). The strengthening $ and the potential impact of Trump policy changes (e.g., Net Neutrality) could be material factors for NFLX in ’17, tho we believe the market will mostly focus on International Sub Adds, and we aren’t expecting a material change in NFLX’s bandwidth cost structure anytime soon.
….
Key factors to focus on: 1) Subscription metrics – We are estimating 1.46MM net new U.S. streaming subs and 3.75MM net new International streaming subs, roughly in line with guidance; 2) Domestic streaming margins – We are looking for a 36.9% segment contribution margin (up 260 bps Y/Y), which implies 36% Y/Y growth in Netflix’s Q4 Domestic streaming contribution profit; 3) International losses – We anticipate International contribution losses of $75MM, up from a $69MM loss in Q3and driven by international market launch/localization costs.
And here is the part that is more art than science. This is how Mark gets to his target, based on sum of the parts valuation:
[caption id="attachment_69531" align="aligncenter" width="600"]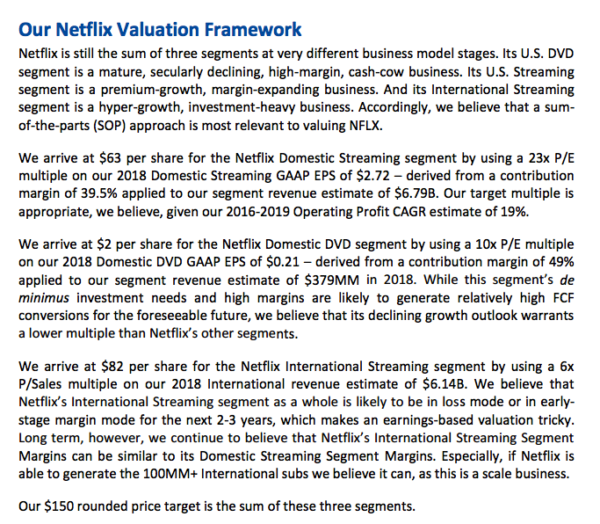 RBC Research[/caption]
Our View: as discussed in Friday’s hit from Options Action, the set up into earnings is binary, especially when you consider that the implied 10% move in either direction is nearly the equivalent of $6 billion in market capitalization, That’s also nearly equal to their $6.7 billion in 2015 sales. Placing bets prior to NFLX earnings (and that is exactly what you are doing) is not for the feint of heart. But defining risk and hedging is the wise thing to do in an outlier like NFLX.
So what’s the trade?
For those long NFLX, a breakout above the all time highs is a distinct possibility, but so is a bad failure.
Hedge vs 100 shares of NFLX (133.30) Buy the Jan 123/108 put spread, 150 call collar for 1.00
- sell 1 Jan 150 call at 1.00
- Buy 1 Jan 122 put for 2.20
- Sell 1 Jan 108 put at .20
Rationale – This hedge costs 1.00 and protects for a breakdown below the 50 day moving (around 123) all the way to 108 (less the 1.00 paid). If the stock breaks out higher you are called away in the stock at the effective sale price of 149 (12%+) higher, outside the implied move and outside the 4 qtr average move. For those concerned that the call sale is too tight it can be moved higher but of course the hedge will cost more (for instance the 155 calls at .50 make the entire trade 1.50). In the case of a 150 call sale, if the stock is above 123 or below 150 on Jan expiration a dollar is lost for the price of the hedge, but that is less than 1% for the $14 dollars in protection on a breakdown below the 50 day moving average.
—–
For those looking to replace a long or for those wanting to buy NFLX for a breakout, defining risk into the print makes sense.
Stock Replacement/Alternative to 100 shares of NFLX (133.30) Buy the Feb 130/155/180 call fly for 6.75
- Buy 1 Feb 130 call for 9.50
- Sell 2 Feb 155 calls at 1.50 (3.00 total)
- Buy 1 Feb 180 call for .25
Rationale – This trade risks 6.75 (about half as much as the $13 implied move) and can make up to 18.25 on a move to 155 on February expiration. The breakeven on the trade is 136.75, just 3.50 above where the stock is trading. If the stock declines the most that can be lost is 6.75 whereas the 155 strike is a good distance away, providing nearly $23 in room for the stock on the upside before profits start to trail off. This trade is slightly more than the one detailed by Mike on the show but it has a lower breakeven level, so is a slightly more conservative breakout play.