Citibank (C) reports Q4 earnings tomorrow morning before the open. The options market is implying about a 2.5% one day post earnings move tomorrow, which is above the 4 qtr average one day post earnings move of 1.5%, but well above the average over the last three quarters of only 25 basis points!
With the stock at $58.50, the Jan 58.50 weekly straddle (the call premium + the put premium) is offered at about $1.65, if you bought that and this the implied weekly move (most of that related to earnings) then you would need a rally above $60.65 or a decline below $56.85 to make money.
In an earlier post (here) I highlighted my Options Action co-panelists Carter Braxton Worth’s bearish technical take on C into the print and Mike Khouw’s options trade idea that at the very least plays for a continued pause, or a consolidation of gains by selling options premium…
There were a couple options trades in the market today worth noting on the eve of earnings, both look to be traders rolling prior bullish bets (or possibly hedges to short, you just never know).
First, shortly after the open when C was $58.65 a trader sold to close 10,000 Jan 60 calls at 33 cents and bought to open 10,000 Jan 59 calls for 68 cents. This new trade breaks-even on Friday’s close at 59.65, up 1.7% from the trading level, and below the implied earnings move. This might be a trader leveraging up an existing long position.
And then shortly before 1pm, when the stock was $58.67 a trader sold to close 20,000 March 65 calls at 40 cents and bought to open 20,000 April 65 calls for 81 cents. These new calls break event at $65.81 on April expiration, up 12% from the trading levels and gives the trader an extra month.
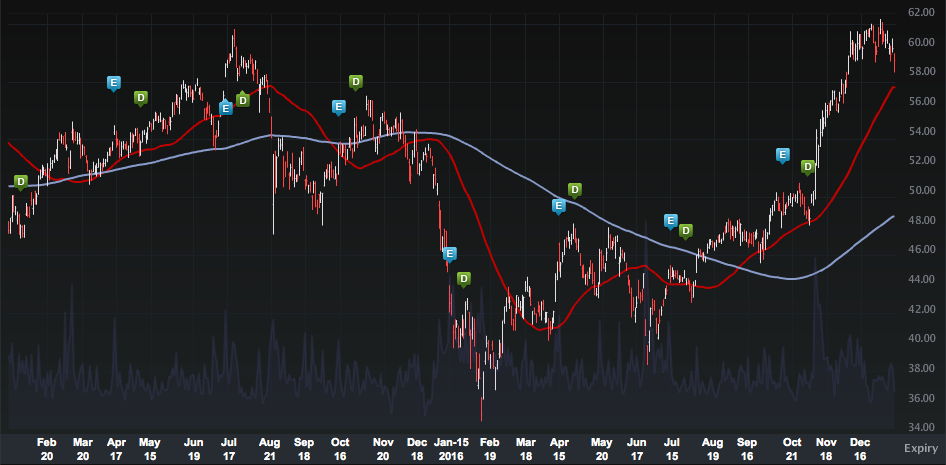
Citi stock got above 61 to start 2017 but has failed a bit since. That was an attempt at a breakout above the high from the Summer of 2015:
It’s kind of a waste of time trying to chart Citi long term, given the stock’s 10 for 1 reverse split in 2011. There are no useful points of reference on this chart:
[caption id="attachment_69552" align="aligncenter" width="600"]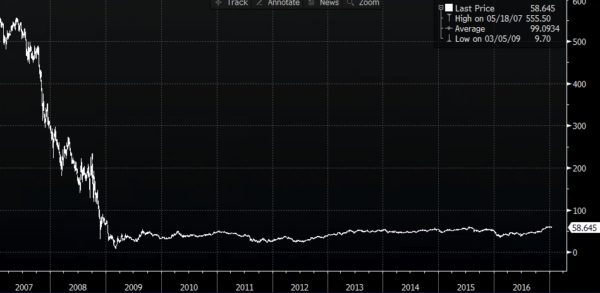 Citi 10 year chart from Bloomberg[/caption]