MorningWord 1/19/16: Bank Stocks – The Meh, the Bad and the Ugly
by Dan January 19, 2016 9:33 am
• Commentary
You know the old bear market saying, sell the rumor and buy the news. Overnight China released economic data that whiffed across the board and included the lowest GDP print since 2009. A good bit of the negative sentiment about the pace of China’s economic slowdown that has U.S. stocks get off to their worst January ever was clearly already in equities. And stocks are higher this morning with the S&P 500 futures up 1.5% as I write. We’ve suddenly gone from a dire risk off on Friday to what feels like a healthy bounce this morning, lets see if it can stick.
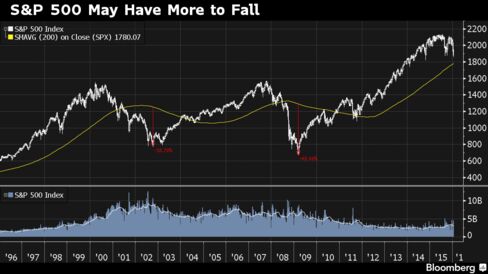
With the SPX down 8% ytd as of Friday’s close (down 12% from its all time highs made last May), there are some who are trying to put the correction in context given the enormity of the gains from the lows of the financial crisis in 2009, from Bloomberg:
The Standard & Poor’s 500 Index remains more than 5 percent above its 200-week moving average, and has not spent this long continuously above it since the 1990s dot-com era. When that bull run finished, the market fell to 38 percent below the 200-week moving average, while the 2009 crash bottomed out 48 percent below it.
A look at the breadth of the S&P 500 tells an interesting story this time around, with the performance of a few dozen stocks behind much of the index’s recent performance, while many sectors are already in a bear market.
In my mind, there are none more important than financial stocks, as they serve as a barometer for so many crucial factors that transcend many other sectors in the stock market.
After a quick review of the performance (or lack thereof) of global banks stocks year to date, and from their 52 week highs displays serious angst among investors, but huge bifurcation between the very recent weakness in U.S. banks stocks, and that of those in Europe and Asia, which for all intents and purposes seemed to have never emerged from crisis mode.
Here is a quick look at the charts of global bank stocks which I have broken down into a few groups, The Meh, The Bad & The UGLY;
THE MEH:
JPM Morgan (JPM): shows the best relative strength in the entire group globally, well above its Aug 24th flash crash low of $50, but broken its long term uptrend, down 13.6% on the year, and about 20% from its 52 week highs. I suspect before its all said and done with see $50 in the not to distant future:
JPM 6 year chart from Bloomberg
Bank of America (BAC): The 6 year chart below shows the multi-year consolidation from late 2013 till now between $18 on the upside and $14 on the downside, a level the stock is once again testing. The stock is at a precarious to say the least as there is little support until about $12. BAC is down 14% on the year, and down 21% from its 52 week highs:
BAC 6 year chart from Bloomberg
THE BAD:
Citigroup (C): Much like BAC, the stock has consolidated the last 2 years or so, but Friday in reaction to their Q4 results the stock broke down below that long term support. THIS IS A NASTY CHART, I suspect $45 becomes formidable technical resistance:
C 6 year chart from Bloomberg
Goldman Sachs (GS): This one is a bit surprising given the collective sentiment that GS as a firm rarely gets caught off-sides by the sort of economic and market trends that routinely trip up their competitors, and usually profit from them. GS is down 14% on the year and shockingly almost 30% from its 52 week highs, and at key technical support:
GS 6 year chart from Bloomberg
Morgan Stanley (MS): similar to GS, expected to be more nimble than its moneycenter peers BAC, C & JPM, and given their massive push into asset management, perceived to be more insulated from the whims of capital market trends. MS has completely broken down through 2 year support, down 18% on the year and down more than 35% from its 52 week highs:
MS 6 year chart from Bloomberg
THE UGLY:
Credit Suisse (CS): it appears the European Sovereign Debt crisis never ended for European banks. CS is down 14% on the year and 38% from its 52 week highs:
CS 6 year chart from Bloomberg
Deutsche Bank (DB): same as CS, very near financial crisis lows, been trending lower since the supposed end of the Euro Debt crisis, down 13% on the year, and down 40% from its 52 week highs:
DB 6 year chart from Bloomberg
China Construction Bank: The stock which trades in Hong Kong had a short-lived rally last Spring with Chinese stocks, but is now at multi-year lows and down 40% from its 52 week highs:
China Construction Bank 6 year chart from Bloomberg
HSBC: same thing down 30% from its 52 week highs:
HSBC 6 year chart from Bloomberg
A picture tells a thousand words. Global bank stocks tell a very different story than the shallow correction in the S&P 500 from its 2015 highs. Either investors are massively overreacting, or the weakness in bank stocks portends a wider correction in broad equity markets. As far as the categories listed above, The Meh, JPM and BAC appear to be decent candidates to play for a break of support on a weak bounce. The Bad, C, GS & MS appear to be great re-short candidates on a weak bounce to prior support. The Ugly, avoid all together, and use as a sentiment barometer, almost like a leading indicator for the weakest spots in the global economy.