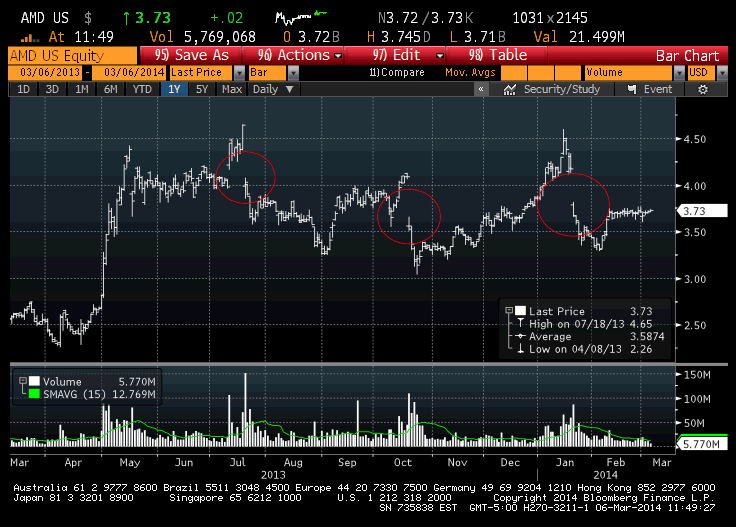
Back in March we took a short term bullish view on shares of AMD and saw a 9% gain in a matter of weeks as the stock caught a bid into quarter end and we took our profit and moved on (see below). Yesterday some options activity caught our eye with total volume almost hitting 2x average daily volume, with calls dominating. The three most active lines were 6300 June 6th (this week expiration) 4 calls, 2200 June 13th (next week expiration) 4 calls and 1600 June 21st 4 calls, most being bought, all for 12 cents or less. Obviously these trades don’t represent a lot of premium, but the direction and the short dated nature suggest someone was hearing something (Briefing.com referred to the call activity, citing takeover rumors, possibly by TXN).
Back in March it was our view that the stock was essentially an option and see little reason to trade options around the name. One would do so though if they thought there was a chance for a sharp move to the upside and was interested in leverage. We have not heard the takeover spec, but AMD’s $4 billion enterprise value would not make it a hard target for most larger players.
With the stock back at the levels where I sold back in March I thought it was worth taking another look. On a one year basis, the stock made a fairly impressive reversal in April (circled in green) of what was becoming an ugly trend of gapping down after earnings results (circled in red):

Taking a longer term view though, the stock is basing at a fairly important infleciton point from a technical standpoint, $4:

There are 2 instances in the last 6 years where the stock appeared to be in a death spiral, bottoming out near $2, the lows of the financial crisis, and then again in late 2012. Fear of a 50% drop from current levels though could cause some bulls to define their risk, or look to the options market to add leverage to existing longs.
The five year chart below of 30 day at the money implied vol shows options prices recently coming off of 5 year lows, which would be indicative of speculative buying. While the prices look low, the options still trade at a 40 vol!, which is in stark comparison to INTC at 17.

While the calls may look dollar cheap due to the low cost of the stock, they are not on a vol basis. For instance to buy the $4 strike call in Oct, it costs about .45, or about 11% of the underlying stock price, for the right to own the stock at $4 on October expiration. Doesn’t seem great. We are going to do a little more work on the fundamentals and possibly look for a re-entry in the common.
[hr]
Previous Post March 26th, 2014: Trade Update – $AMD: Gap Filled, Taking Profits
Two weeks ago when AMD was $3.73 I bought some stock as a trade with the thought that the stock would make a run, as it has two times in the last six months, filling in the prior earnings gap before its soon to be reported results.
The stock has filled in the gap, rallying 23% from the Feb lows and 9% since I bought the stock. With my trade objective achieved, I am now going to part with the shares and take the quick gains.
Action: Sold to Close AMD shares at $4.06 for a .33 or 9% gain in 2 weeks.
[hr]
Original Post March 6th, 2014: New Trade – $AMD: Minding the Gaps
This past Monday, some sizable put activity in AMD caught my eye. A buyer paid .69 for 15,000 July 4 puts when the stock was 3.64 (.36 in the money at the time). The premium paid equaled about 19% of the underlying stock price, so this was either a very convicted bearish bet, or was protection for a long stock position of 1,500,000 shares of stock.
The options activity caused me to look at the stock, which I have not done in a while. The one year chart is quite fascinating, with three massive gaps lower following the last three earnings events (circled), equaling -12%, -13.7% and down 13.15% respectively.

What’s interesting about this pattern is that heading into each of the last 3 earnings reports, the stock had been at 3 month highs heading into the print, and after the earnings gap has gone on to make much lower lows before stabilizing.
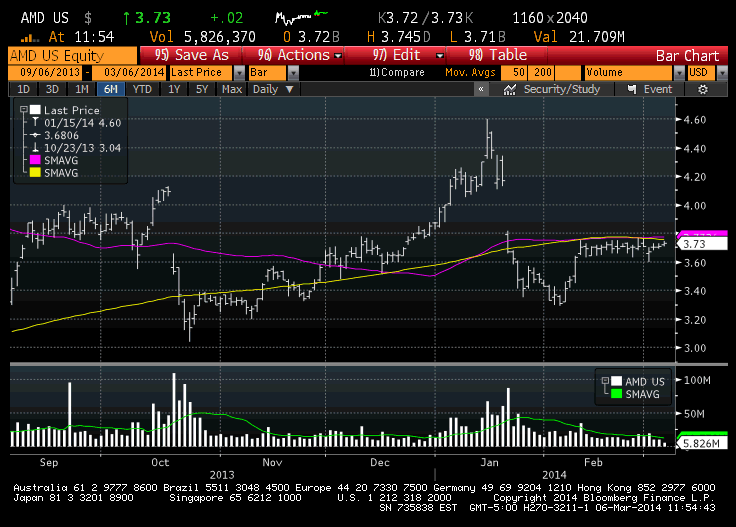
The 6 month chart below shows the stock’s recent flailing for the last few weeks, making a healthy looking consolidation just below its converging 50 (purple) and 200 (yellow) day moving averages.

If recent history serves as a guide, the stock could be building up steam for a breakout to fill in the January earnings gap as it gets ready to report Q1 earnings that should come out in the last week of April.
Sentiment on the stock is quite poor, with about 20% short interest. The analyst community is quite mixed, with 7 Buys, 13 Holds and 7 Sells and an average 12 month price target of about $3.95, or about 6% above where the stock is currently trading.
The fundamental picture for AMD is murky at best. Its capital structure could become strained in the next economic or cyclical downturn. In 2012 and 2013, the company had losses on the earnings front accompanied by overall sales declines. Analysts expect sales to grow and earnings to be back in the black in 2014. While there has been a lot of chatter about the death of the PC, some component suppliers have been able to weather the secular headwinds. Not AMD, who has experienced far worse declines than the industry and competitors in their core MPU (microprocessor) sales. In the near term, possibly the only silver-lining is that the guidance that they gave in January for the current quarter is low enough that the company will actually be able to meet expectations or better.
Maybe fundamentals and the sentiment are so bad that they set up well for a short term bullish trade? The one year chart below of 30 day at the money implied volatility (blue) vs the realized volatility (white) shows that options are not exactly cheap in the stock. AMD has not moved in the last month, yet options prices (implied) are about 25% higher than the recent lows:

Its also interesting that just as I was about done with this post, I saw the following Tweet from the illustrious Melissa Lee with whom I will be on Fast Money tonight:
$AMD R9 290x GPU graphics card seeing strong demand- fr cryptocurrency miners! Prices to $900 vs MSRP $548. AMD CEO joins @CNBCFastMoney 5p
— Melissa Lee (@MelissaLeeCNBC) March 6, 2014
So maybe the next leg is not about MPU, but about GPUs??? Admittedly I don’t know a whole heck of a lot about the company, but playing for a gap fill given the recent history looks like a decent play.
So what’s the trade? Sorry people not much to do in the options market for short term bullish plays. With the stock seemingly in standstill, waiting for it to move could be disastrous for out of the money calls as they would just wilt away. I am merely going to buy stock here and play for a gap fill and move on, PRIOR to earnings.
TRADE: AMD Bought stock for $3.73
Downside Stop: Will use a mental stop of $3.50 on the downside.