Yesterday we laid out the case (below) for a potential trade in XLE, though we decided to wait until this morning rather than rush a trade into the close.
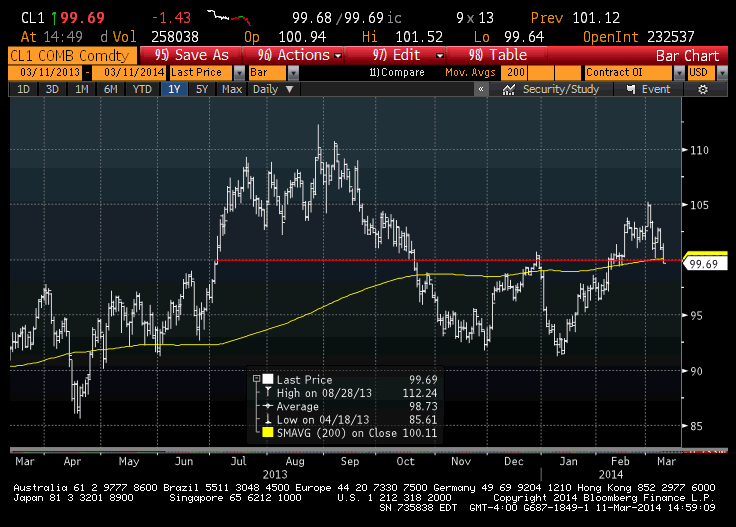
This morning, WTI crude oil is down another 1.5%, moving below its 200 day moving average as well as the psychologically important $100 level. In fact, front month WTI oil is now unchanged on the year, after being up more than 5% at the start of March.
Since March 3rd, oil is down more than 5%, while XLE is actually only down a touch. In addition, XLE was unable to break above the Dec 31st high on the most recent move higher. It is one of the few sector ETFs that has essentially spent the entirety of 2014 in the red, which does not bode well going forward as portfolio managers are likely to dump their losers before their winners if the market sees more weakness.
Put those two together, and we are going to take our entry on the XLE put fly position this morning:
New Trade: XLE ($86.93 ) Bought the April 88/84/80 put fly for 1.01
– Bought 1 Apr 88 put for 2.48
– Sold 2 April 84 puts at .90 (1.80 total)
– Bought 1 April 80 put for .33
Break-Even on April Expiration:
Profits: btwn 87 and 81 make up to 2.99 with max gain of 2.99 at 84
Loses: btwn 86.99 and 88 & btwn 81.01 and 80 lose up to 1.01, max loss of 1.01 above 88 and below 80
Rationale – This structure works well for a bearish bias without paying decay over the next month. We’ll look to take it off around the $84 level if XLE makes a move there in the coming weeks.
[hr]
Original Post March 11th, 2014: Name That Trade – $XLE: Crude Set Up
Crude oil is trading at its lowest level in almost a month, below its 200 day moving average and the psychologically important $100 level.

The commodity first saw a ramp a couple weeks ago as tensions started to heat up between Russia and the Ukraine, but has since given back all gains, likely to do with what appears to be a dreadful demand picture from emerging markets, particularly China.
Oil stocks have been a mixed bag of late and certainly a bit volatile with a couple high profile guidance disappointments from two giants, XOM and CVX. The two stocks combined make up almost 30% of the XLE, the Energy Select etf.
The six month chart below shows the etf’s failure at the 2 prior highs from Jan and Dec, and today’s rejection that could mark a nasty triple top. In the near term, a meaningful decline in the underlying commodity could signal a retest of the next obvious support level at the 200 day moving average at $84.

I want to make a defined risk bet that the weak demand picture will outweigh any increased tensions in the Ukrainie and that the XLE will re-trace a good bit of its recent bounce off of the February lows, but not at this exact moment, its hard to press a short on a down day like this. On the first bounce, possibly tomorrow morning, I will look to establish the following trade:
Hypothetical Trade: XLE ($87.15 ) Buy the April 88/84/80 put fly for 1.00
– Buyto open one Apr 88 put for 2.50
– Sell 2 April 84 puts at .90 (1.80 total)
– Buy 1 April 80 put for .30
Break-Even on April Expiration:
Profits: btwn 87 and 81 make up to 3.00 with max gain of 3.00 at 84
Loses: btwn 87 and 88 & btwn 81 and 80 lose up to 1, max loss of 1 above 88 and below 80
Rationale – We don’t love the timing of this trade near the end of the down day and would love to time this trade on an up open. If we saw a big enough up open it’s possible we’d widen the strikes a bit.