Last week, we discussed the potential for EEM outperforming SPY in the second half of 2013 in my macro wrap post. The evidence for global rotation is slowly building in Europe’s favor as well, and the Euro Stoxx 50 index closed higher for its 5th straight session today.
Josh Brown illustrated that short-term outperformance in his post today:
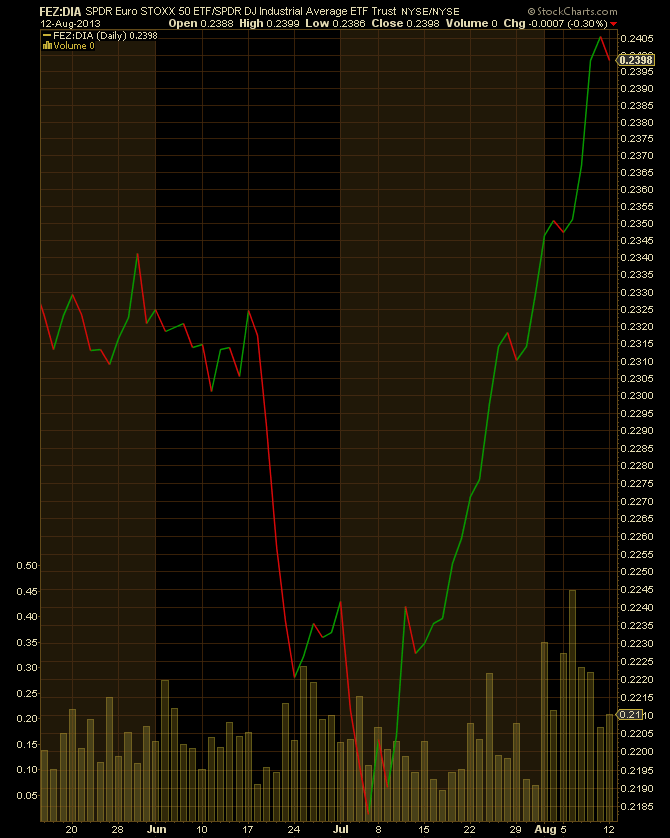
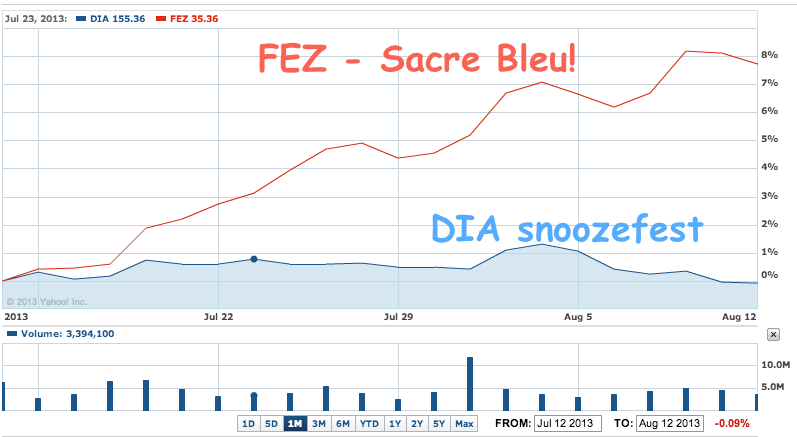
Below, a ratio chart I’ve created of the EuroStoxx 50 priced in the Dow Jones Industrial Average using the ETFs. Under that is a straight-up performance of the two over the last 30 days.
The FEZ is the “Dow of Europe” ETF, it tracks the EuroStoxx 50 Index of large caps and is dominated by French (Sanofi, Total), German (Bayer, BASF), Spanish (Banco Santander) and other giants of the continent.
As you can see below, since the June lows prompted by Bernanke’s taper talk, the European Dow has been crushing the US index.
I had been looking at the Europe / U.S. ratio last week, and what stuck out to me was just how depressed Europe remains vs. the U.S. on a long-term timeframe. Here is the 10 year chart of the ratio of the Euro Stoxx 50 index vs. the S&P 500 index:
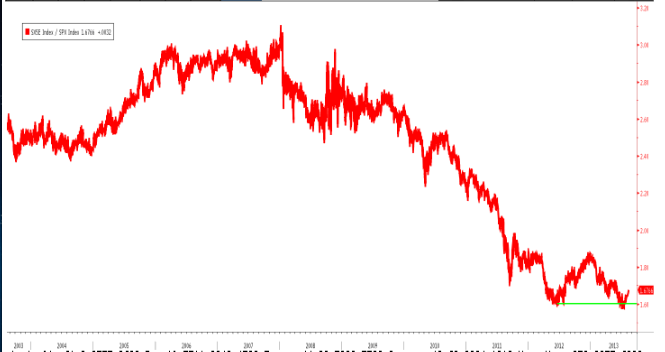
However, the recent bounce is a reason for optimism, as the ratio tested its 2012 low and essentially bounced near there. Importantly, the ratio is now almost flat over the past 2 years, which is especially surprising since it feels like the U.S. has significantly outperformed the rest of the world since the fall 0f 2011. In fact, Europe has maintained a similar pace to the upside. The ratio might finally be turning after 6 years of severe underperformance for Europe (the ratio has halved since the end of 2007).
When I look at valuations of the stocks in the Euro Stoxx 50 index, the valuation differential significantly favors European names over U.S. stocks. 5 of the top component comparisons (with the usual caveat that this is a simplistic exercise):
- Sanofi – 14.5x P/E with 10-15% EPS growth projected, 3.5% dividend yield. Pfizer – 13.5x P/E with 5% EPS growth projected, 3.3% dividend yield.
- Total – 8.5x P/E with 0-5% EPS growth projected, 5.8% dividend yield. Exxon Mobil – 11.5x P/E with 5% EPS growth projected, 2.8% dividend yield.
- Siemens – 15.5x P/E with 20% EPS growth projected, 3.6% dividend yield. General Electric – 14.5x P/E with 10% EPS growth projected, 3.1% dividend yield.
- Daimler – 12x P/E with 15-20% EPS growth projected, 4% dividend yield. Ford – 11x P/E with 15-20% EPS growth projected, 2.4% dividend yield.
- Unilever – 18.5x P/E with with 10% EPS growth projected, 3.4% dividend yield. Procter and Gamble – 19x P/E with 10% EPS growth projected, 3.0% dividend yield.
Of those 5 large cap comparisons, Ford over Daimler is the only one that I would prefer. Once again, U.S. stocks look expensive vs. their global peers that are in similar businesses.
In the short run, the U.S. could continue to outperform, as psychology, sentiment and money flow dominate, but in the long run, the valuation setup seems to favor global outperformance vs. the U.S., which would be quite a shift compared to price action over the last 2 years.