In the past month, I’ve seen many variations of the following 2 charts, comparing the performance in the S&P 500 in 2013 to the start of 2012 and 2011. Here are the 2 charts, courtesy of the team at Bespoke Investment Group:


The 2013 rally has tracked both 2012 and 2011 quite closely. It is natural to draw an inference about the seasonal impact of January and February on strong gains in the stock market (though sample size too small in my opinion).
Regardless, how apt is this comparison given the broader market backdrop? One major difference in 2013 is the lack of upside surprises in the U.S. economic data compared to the strong upside surprises vs. consensus in 2011 and 2012. I plotted the Citigroup Surprise Index for the U.S. against the S&P 500 over the past 3 years:
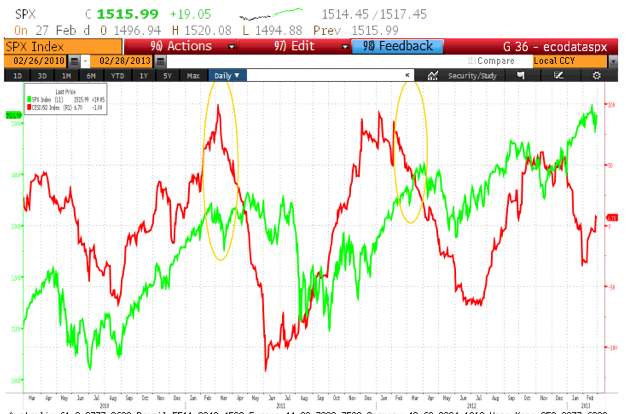
I’ve highlighted where the markets stood in late Feb / early March in 2011 and 2012 with gold ovals. What I wanted to illustrate is the high number of economic surprises (with Citigroup Surprise Index readings between 25 and 100 for the entire period) as the SPX rallied in Jan and Feb of 2011 and 2012. In contrast, the economic data has actually been surprising to the downside for most of February 2013, and the latest reading around 6 is not exactly gangbusters.
In other words, a large divergence has developed between the economic data and the stock market’s price action. (Note: the Surprise Index simply measures the surprises relative to consensus, not the actual level of the data, but the actual level of the data has been weaker as well. The 4th quarter GDP print is the most encompassing example of that). The bullish argument is that the recent data has been skewed lower by the fears of the fiscal cliff in the 4th quarter. However, the sequester on top of the payroll tax hike are a substantial negative combo for an already weak economy.
So for all the talk of new highs, the market’s current situation looks quite precarious to me. Markets can act irrationally for a long time, but the risk/reward favors the bears here, from a fundamental and cross market asset perspective (currencies, commodities, bonds).