Here’s a preview of what I’ll be discussing on Talking Numbers today between 3:20 and 3:30 pm EST on CNBC:
XHB has doubled since its low on October 2011. That’s extraordinary performance for any asset, but especially for an ETF in which no component comprises more than 4% of the fund. In fact, XHB 34 single stock components, and the ETF is close to equal weighted. So, the mean performance of 34 single stocks is more than 100% gain in the past 16 months. Quite astounding.
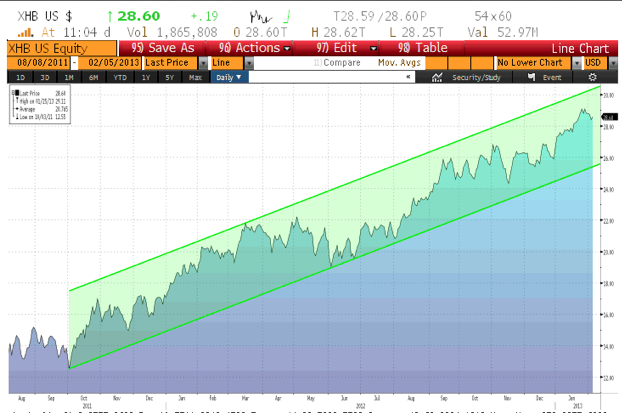
The chart of XHB has traced out a nice trend channel since its Oct. 2011 low:

With the ETF now near the upper end of the trend channel, I expect that a pullback is imminent. In the past week, XHB has already shown signs of weakness, as the broader market is flat, while XHB is down 2% in that span. Today, the ETF is close to flat, while the U.S. market is up almost 1%. That loss of relative strength is an early signal that a pullback is coming.
Where do I expect XHB to find support? The 26-26.5 area was prior resistance in Sept-Dec 2012, and that prior resistance will likely act as support on the way down. In addition, the trend channel support comes in around that same area as well.
Regardless of the technical situation, I’ve mentioned before that I see much better ways to play the upside story (like Ford) in housing than homebuilders here. Homebuilders have more than priced in the housing recovery, and now trade quite expensive to their historical valuation metrics, and extremely expensive vs. other companies indirectly exposed to the housing recovery. The market is currently offering a gift to homebuilder longs. If I were them, I would take it, and get out of this sector for now.