This is a continuing series on options trading terms and techniques. Part I and II are here. We’ll be following up with Parts VI and V shortly.
Part III
Volatility
The two types of volatility we refer to on this site are historical and implied volatility. Historical volatility is measured from the actual movement of the stock over a time period. So the 20-day historical volatility or hv20 is measured from how much the stock has actually moved in the previous 20-day period. If the stock moves a lot the volatility will be higher than if the stock moves very little. Implied volatility, on the other hand, is derived from the price of the option. The implied volatility is derived from the difference between the market price of an option and what the price would be given just the inputs of stock price, strike price, time to expiration, interest rate, dividend, and cost to borrow stock. The implied volatility tells you what the market predicts the volatility of the stock will be going forward. If the implied volatility is higher than historical then the market is predicting that the stock will move about more than it has in the past.
On a practical basis, when people buy options, market makers raise the price and when people sell them options, they lower it. Implied volatility is constantly changing. So if implied volatility is high on a particular option or a strike or a month, it usually means people have been buying those options. (Why do people buy particular options in large quantities? They might be buying them because they know something you don’t know; they might be buying them because of a rumor; they might be buying them to hedge a large stock position or to balance a portfolio.) What do we mean by high? Generally, we mean higher than historical for the same period, but we may also mean in comparison to other option strikes or expirations or in comparison to implied vol in a previous period.
When implied volatility goes up the price of the option goes up because there is a greater chance that that option will finish in the money. So ideally you want to buy low volatility and sell high volatility. With directional trading, volatility may not be your primary consideration, but it should be considered as it should affect your choice of strategy. Volatility helps you assess the relative value of different options.
Some considerations in volatility:
When looking at what options to buy or sell it is important to consider implied volatility. Even if you are making a directional play, a change in implied volatility could mean that the price of the option goes down even if the stock goes in your direction or goes up even if stock doesn’t move or moves against you. Take a look at implied volatility charts. If you are considering a front month option (the month you are in) then you should take a look at hv 20 or hv30 vs. iv20 or iv30 (30 day average implied volatility). If you are considering an option line two months out take a look at hv60 vs. iv60 and so on. If implied vol is trading considerably higher than historical then this is something to take into account.
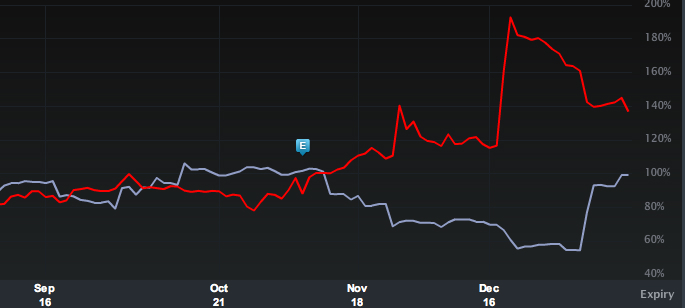
Graph of IV30 (red) and HV30 (blue) for Achillion Pharmaceuticals Inc. (ACHN) on January 18, 2012. Spike up on December 19th corresponds to a takeover of another company that also makes hepatitis C virus (HCV) drugs and rumors there might be other takeovers. from LiveVol Pro
It might mean you want to do a call or put spread instead of just buying a call or put. We will discuss call and put spreads in upcoming posts. Also look at implied volatility over time. Is this the highest iv30 has traded all year? You always want to ask yourself why volatility may be up or down. Has there been news about this product, are earnings coming up, is it a takeover candidate? You want to make sure that whatever event you are predicting hasn’t already been priced into the options thus making your strategy less appealing or making one strategy preferable to another.
Skew
Volatility tends to go up leading into events, so you may find expirations trading at very different volatilities when it is known that one month has news (earnings, FDA drug approval, court decision, etc) and another is not expected to.
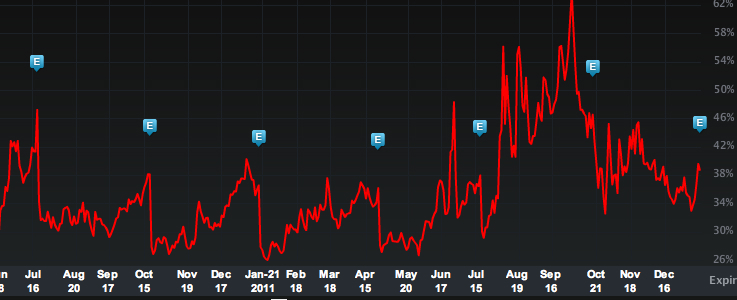
Graph of IV30 for Ebay from Jun 2010 to Jan 18, 2012. from LiveVol Pro
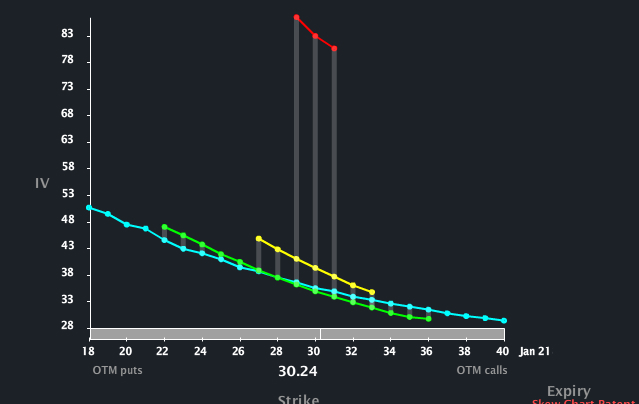
Horizontal Skew
This volatility difference between months is known as a horizontal volatility skew or term structure volatility.
Graph of vol skew in Ebay on earnings Jan 18, 2012. Red line is options expiring Jan 21, yellow is Feb 18, green is April 21, light blue is July 21. from LiveVol Pro
This can lead to certain strategies such as time spreads. You might think that a back month (later expiration date) is trading at too high an implied volatility in comparison to historical if the news is happening before front month expiration. So you might buy volatility in the front month and sell in the back month. We will discuss time spreads in greater depth later on and in relation to Greeks as well. Volatility is mean reverting, but the time period is unknown. Therefore if you feel volatility is high and want to sell it, you need to consider time-frame. Options closer to expiration have larger swings in volatility than those farther away. It is safer to sell volatility farther out in time, but again you have to keep events in mind, like the next earnings cycle.
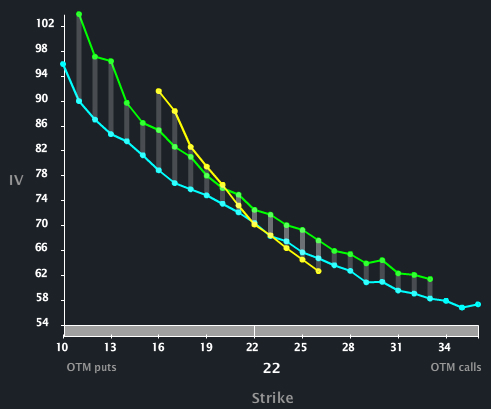
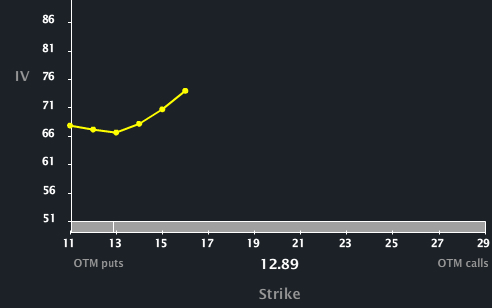
Vertical Skew
Iv30, Iv60, etc is either averaged across weighted strikes or taken at-the-money, but you will find that all strikes in a given expiration do not trade at the same volatility. This is called vertical skew. In most equity stock options the skew is such that lower strikes trade at a higher implied volatility than higher strikes up to at-the-money. Then the skew may flatten and descend or may go up again. In the majority of equity options, the skew will continue to descend.
Graph of vertical skew in Focus Media Holding Ltd. (FMCN) on Jan 18, 2012. from LiveVol Pro
This is because equities tend to crash down and go up in an orderly fashion. Also the nature of the trading universe is such that more people own stocks than are short them. The default option position against being long stock is to buy puts for protection and sell calls for income.
As you get farther away from at-the-money, options have a smaller vega, this means that the price is less affected by changes in volatility. So to keep an out-of-the-money put from being offered at too low a price, option market makers have to jack up the volatility. So for an out-of-the-money put you may see volatilities that seem extraordinary compared to at-the-money.
If out of the money calls have elevated implied volatilities, thus making what is called a “volatility smile,” the market may be indicating the likelihood of an event like a take-over. This can also be referred to as “elevated tail risk.” For example RIMM at the end of 2011 had gone down so significantly in price that the market couldn’t imagine any more bad news so the vertical skew looked more like a crooked smile with out-of-the-money calls showing high implied volatility on the expectation that there might be a takeover or some kind of change announcement. Some very volatile industries like biotech often have upsides skews.
Graph of volatility skew in Jan 21, 2012 options of Research in Motion Ltd. (RIMM) on Dec 19, 2011. from LiveVol Pro
Conversions, Reversals and Hard-to-Borrow
Puts and calls of the same strike usually trade at the same volatility. This keeps the reversals and conversions in line. If you buy a call and sell a put of the same strike, your graph of profit and loss looks exactly the same as if you had bought the stock.
Graph from Option Volatility and Pricing by Sheldon Natenburg, p. 215.
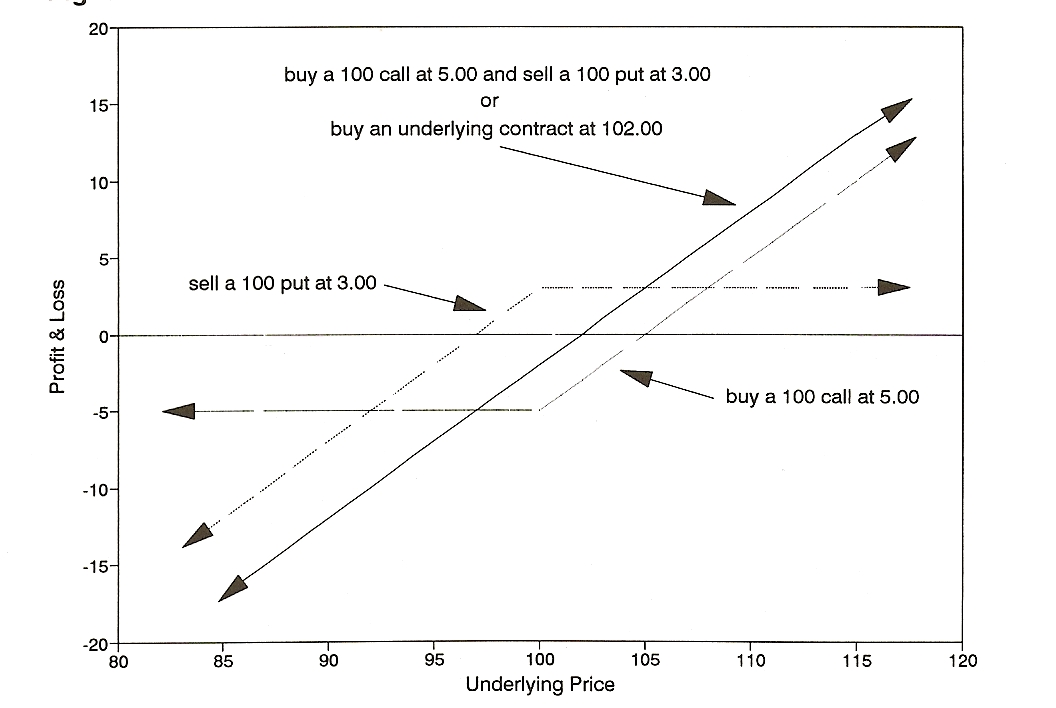
This is also known as buying synthetic stock.
long call + short put = synthetic long underlying
short call + long put = synthetic short underlying
If you then sell the stock you’ve done a conversion. The opposite is a reversal. If you make money on this you have done an almost riskless arbitrage, but . . . .
Usually prices are lined up so that you can’t make money on the conversion and reversal. If you see reversals/conversions out of line, for example if the puts are trading at a higher implied volatility than the calls, this can indicate a few things you should be aware of. There may be an unknown dividend. Some companies, often foreign ones, are known to announce big dividends suddenly or the dividend may not be known. Or a stock may be hard-to-borrow (HTB). In this case to sell short a stock you have to pay your clearing firm a short interest rate which can change day-to-day and they might ask you to cover that stock at any time. This process is very non-transparent, pretty much a black box, so you can’t know what your interest rate will be or if the money you’ve received in the arbitrage is enough to cover it. These can be good trades if you’ve properly assessed the risk or maybe if you are sleeping with the HTB person at your clearing firm, but they are not something that we will be going into on the site, at least not in the near future except maybe to note the situation.
Vol of Vol
Options that have large fluctuations in implied volatility have what is referred to as a high vol of vol (volatility of volatility). As we noted, options closer to expiration have a higher vol of vol than options with later maturities. This is also a tool for comparing underlyings and determining risk. Something like a pharmaceutical stock will have have options with a very high vol of vol as the stock’s future is completely dependent on events like clinical studies, FDA findings and court decisions.